The JAK/STAT inhibitor panel used in this study contains multiple pairs of treatments that use the same drug in different formulations (e.g. Ruxolitinib and Ruxolitinib phosphate). We collaborated with students from the University of Oregon Bioinformatics and Genomics Masters Program to analyze and compare these paired treatments. Contributors to this project are listed below:
Allen Institute Mentors
Lucas Graybuck
Palak Genge
Mansi Singh
Yudong He
HISE Support Team
Katherine Brower
Neelima Inalla
Charlie Puente-Matos
For a quick overview of this project and results, Download Our Poster
Dataset
The Allen Institute team processed the single-cell dataset comparing multiple drug treatment pairs using a standard Scanpy (Wolf, et al. 2018) analysis workflow, beginning from raw gene expression counts. They performed quality control, filtered to retain cells with > 200 and < 600 detected genes and fraction of ribosomal reads ≤50% to remove potential multiplets, empty droplets and low quality cells, labeled cell types, and downsampled the data.
By the time the dataset reached our UO BGMP team, it consisted of 25,000 cells per sample, 18 samples (for eight drugs with two formulations each, a positive IL-6 control, and a negative DMSO + no IL-6 stimulation control), and 1,916 measured genes, for a total of 450,000 cells.
Drug Formulation Pairs
| Afatinib | Afatinib dimaleate |
| Baricitinib | Baricitinib phosphate |
| Canertinib | Canertinib dihydrochloride |
| Erlotinib | Erlotinib hydrochloride |
| Gefitinib | Gefitinib hydrochloride |
| NVP-BSK805 | NVP-BSK805 dihydrochloride |
| Ruxolitinib | Ruxolitinib phosphate |
| Tofacitinib | Tofacitinib citrate |
Using Scanpy and anndata (Virshup, et al. 2024) for exploratory data analysis, we checked for underrepresentation of certain immune cell types and chose to exclude CD8aa from our dataset, which only included a total count of 25 cells (compared to 118,058 annotations in CD4 Naive, the most abundant cell type).
Then, we normalized the data through log-transformations and selected 500 high-variance genes among the 1,916 gene panel. We performed dimensionality reduction with PCA and UMAP plots to show that the eight immune cell types formed clear, distinct groups. In contrast, when coloring samples by the 18 drug treatments (including controls), no strong treatment‑specific clustering was observed.
Analysis Methods
Analysis of the preprocessed drug formulation dataset described below are available in our github repository:
coreancutie/JAK-STAT
All of the steps in the analysis can be explored in our Certificate of Reproducibility: Explore our Certificate
Differential Gene Expression
We utilized Scanpy’s built in functions (Wolf, et al. 2018) to perform differential gene expression analysis. For each treatment and cell type, DGEs were determined with log1p-normalized counts using the negative (DMSO) control as the reference through Wilcoxon rank-sum tests. Additionally, DGE was conducted between formulations for each drug pair using the same methodology. For each comparison, gene-level statistics (test scores, log fold changes, p-values, and adjusted p-values) were extracted and compiled into individual results tables. CSV files for each cell type + drug vs. control comparison (preserving all genes in the limited panel) were used as input for downstream gene set enrichment analysis and single sample gene set enrichment analysis.
Gene Set Enrichment Analysis
Pathway enrichment analysis was performed using GSEApy (Fang, et al. 2023) on the differential expression results for each cell type + drug treatment vs. DMSO control. Genes were ranked based by the effect size of differential expression (log fold changes) for each drug—cell type comparison. Pre-ranked GSEA was then conducted using the ranked gene lists to test for enrichment of predefined gene sets from the MSigDB Hallmark, KEGG, and Reactome databases. For head-to-head visualizations, GSEA was also performed between formulations for each drug pair using the same methodology. Enrichment result files include normalized enrichment scores, nominal p-values, and FDR q-values annotated with each cell type and treatment comparison.
Single Sample Gene Set Enrichment Analysis
Pathway enrichment analysis was performed for single samples using decoupler (Badia‑i‑Mompel et al., 2022) on the differential expression results for each cell type + drug treatment vs. DMSO control. We utilized decoupler's built-in function dc.mt.ulm() (Decoupler's Univariate Linear Model), to calculate enrichment scores from the PROGENy and MSigDB Hallmark databases. Enrichment result files include the mean change enrichment scores, p-values, and adjusted p-values annotated with each cell type, drug, and control for each database.
Explore Results
The interactive tools, below, can be used to explore the results of our analyses. Click the header or image to open an interactive Dash-based visualization.
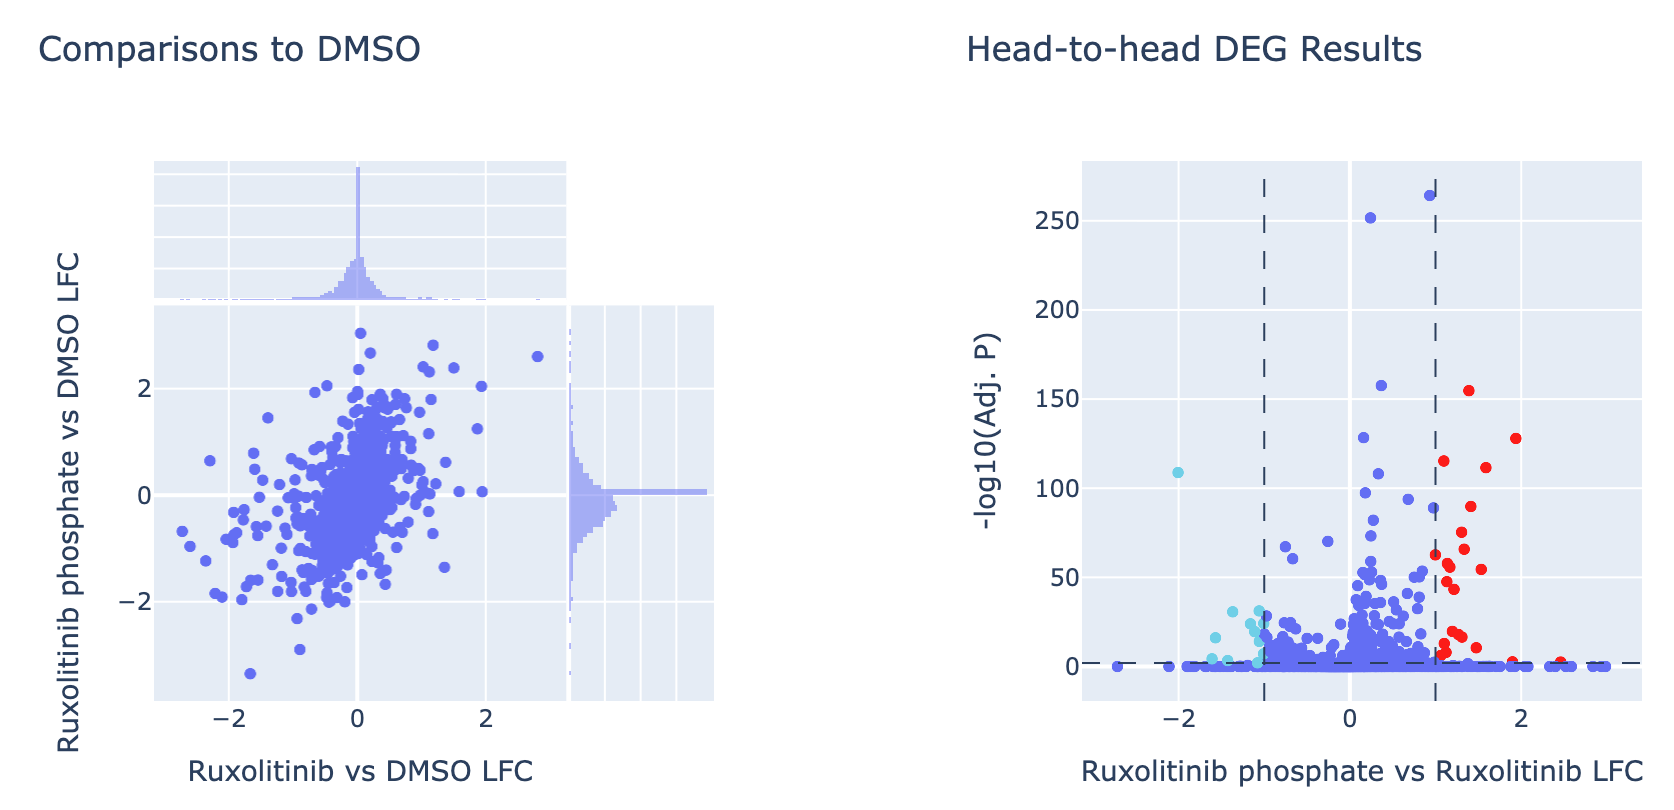
Interactively explore pairs of drug formulations
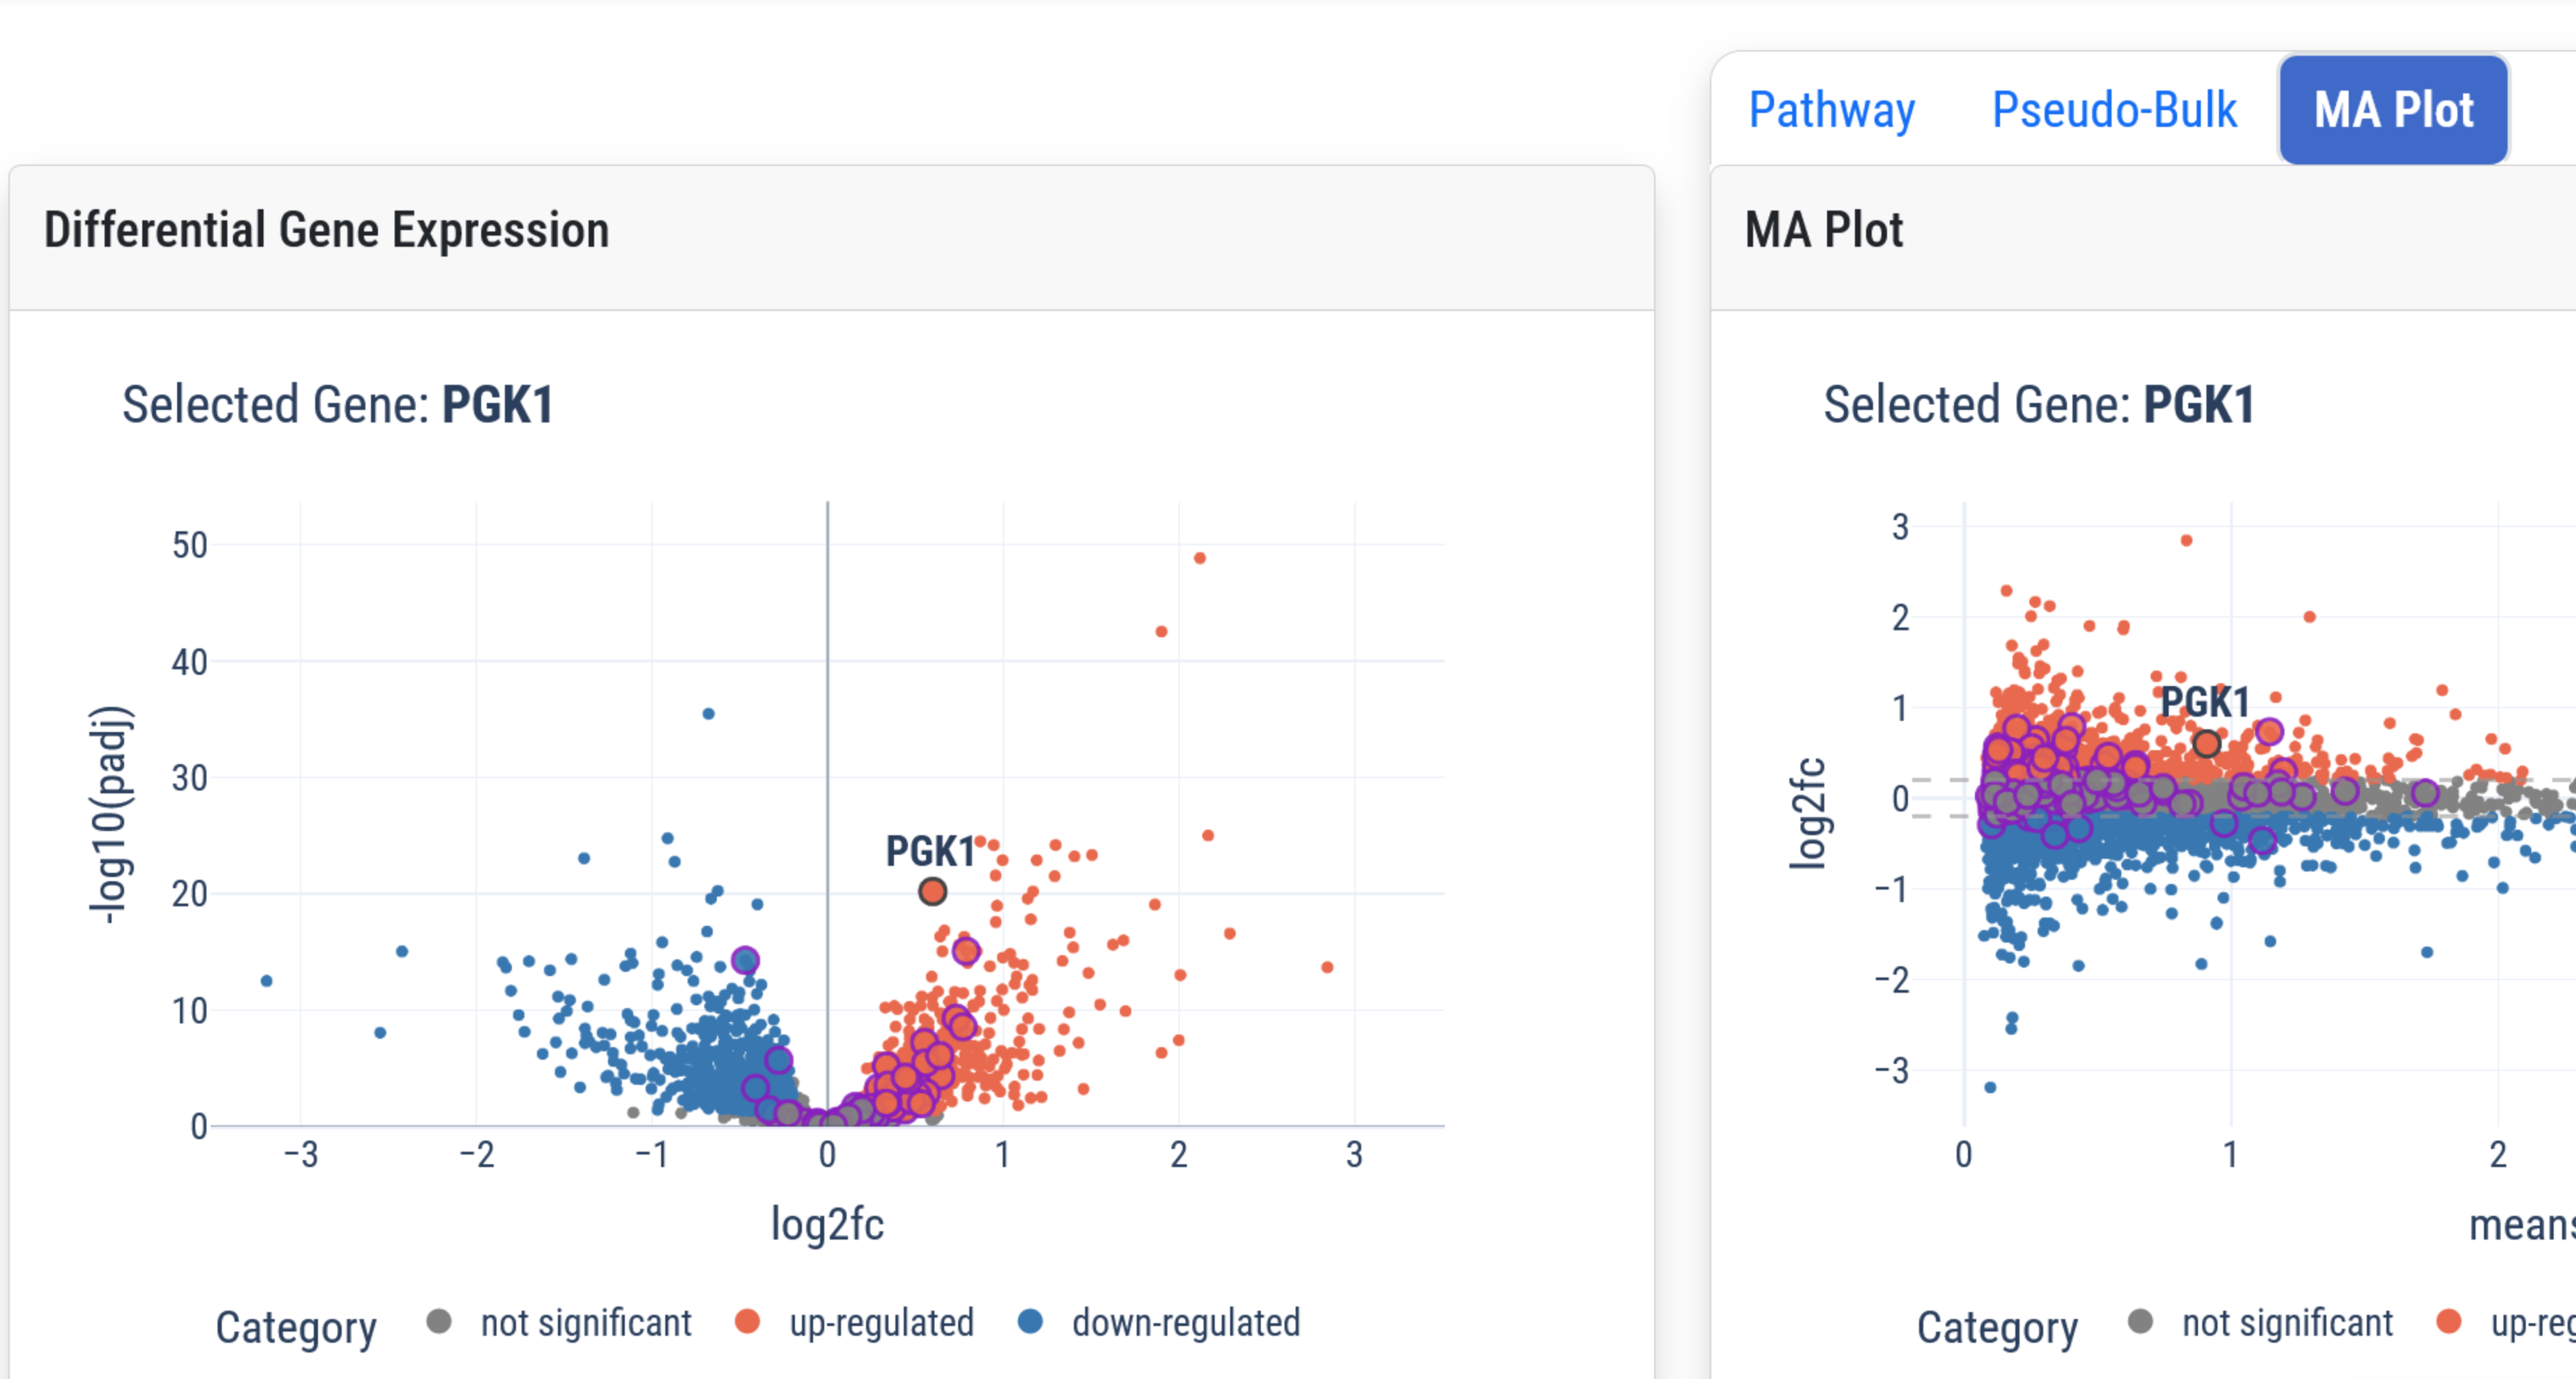
Explore DEGs, GSEA results, and ssGSEA results in comparisons to DMSO controls.
Downloads
scRNA-seq .h5ad file for paired drug formulations
| File Name | Description | Download Link |
|---|---|---|
| il6_jak-stat_paired_formulations.h5ad | scRNA-seq data in .h5ad format |
DEG Results for head-to-head comparisons between formulations
| File Name | Description | Download Link |
|---|---|---|
| head-to-head_wilcoxon_deg_results.csv | Results of Wilcoxon DGE tests |
GSEApy Results for comparisons between drugs and DMSO
| File Name | Description | Download Link |
|---|---|---|
| il6_jak-stat_paired-form_gseapy_hallmark.csv | Results for the Hallmark database | |
| il6_jak-stat_paired-form_gseapy_reactome.csv | Results for the Reactome database | |
| il6_jak-stat_paired-form_gseapy_kegg.csv | Results for the KEGG database |
DEG Results for comparisons between drugs and DMSO
| File Name | Description | Download Link |
|---|---|---|
| wilcoxon_deg_counts_logfc_0.1.csv | Counts of DEGs with LogFC cutoff of 0.1 | |
| wilcoxon_deg_counts_logfc_1.csv | Counts of DEGs with LogFC cutoff of 1.0 | |
| wilcoxon_deg_results.csv | Results of Wilcoxon DGE tests |
ssGSEA Results for comparisons between drugs and DMSO
| File Name | Description | Download Link |
|---|---|---|
| il6_jak-stat_paired-form_ssgsea_hallmark.csv | Wilcoxon test results for Hallmark pathways | |
| il6_jak-stat_paired-form_ssgsea_progeny.csv | Wilcoxon test results for PROGENy pathways |
References
Biology of IL-6 and JAK/STAT signaling
Harmer, D., Falank, C., & Reagan, M. R.Interleukin-6 Interweaves the Bone Marrow Microenvironment, Bone Loss, and Multiple Myeloma. Front. Endocrinol., vol. 9, p. 788, 2019.
doi: 10.3389/fendo.2018.00788
Kim, G. W. et al. IL-6 inhibitors for treatment of rheumatoid arthritis: past, present, and future. Arch. Pharm. Res., vol. 38, no. 5, pp. 575–584, May 2015.
doi: 10.1007/s12272-015- 0569-8
Kishimoto, T. & Kang, S. IL-6 Revisited: From Rheumatoid Arthritis to CAR T Cell Therapy and COVID‑19. Annual Review of Immunology, vol. 40, pp. 323–348, Apr. 2022.
doi: 10.1146/annurev-immunol-101220-023458
Korn, T. & Hiltensperger, M. Role of IL‑6 in the commitment of T cell subsets. Cytokine, vol. 146, p. 155654, Oct. 2021.
doi: 10.1016/j.cyto.2021.155654
Meletiadis, J., Tsiodras, S., & Tsirigotis, P. Interleukin‑6 Blocking vs. JAK‑STAT Inhibition for Prevention of Lung Injury in Patients with COVID‑19. Infect Dis Ther, vol. 9, pp. 707–713, 2020.
doi: 10.1007/s40121-020-00326-1
Xin, P. et al. The role of JAK/STAT signaling pathway and its inhibitors in diseases. International Immunopharmacology, vol. 80, p. 106210, Mar. 2020.
doi: 10.1016/j.intimp.2020.106210
Computational analysis methods
P. Badia-i-Mompel et al., “decoupleR: ensemble of computational methods to infer biological activities from omics data,” Bioinformatics Advances, vol. 2, no. 1, p. vbac016, Jan. 2022.
doi: 10.1093/bioadv/vbac016
Fang, Z., Liu, X., & Peltz, G. “GSEApy: a comprehensive package for performing gene set enrichment analysis in Python,” Bioinformatics, vol. 39, no. 1, p. btac757, Jan. 2023.
doi: 10.1093/bioinformatics/btac757
P. V. Kharchenko, “The triumphs and limitations of computational methods for scRNA-seq,” Nat Methods, vol. 18, no. 7, pp. 723–732, Jul. 2021.
doi: 10.1038/s41592-021-01171-x
I. Virshup, S. Rybakov, F. J. Theis, P. Angerer, and F. A. Wolf, “anndata: Access and store annotated data matrices,” Journal of Open Source Software, vol. 9, no. 101, p. 4371, Sep. 2024.
doi: 10.21105/joss.04371
F. A. Wolf, P. Angerer, and F. J. Theis, “SCANPY: large-scale single-cell gene expression data analysis,” Genome Biology, vol. 19, no. 1, p. 15, Feb. 2018.
doi: 10.1186/s13059-017-1382-0