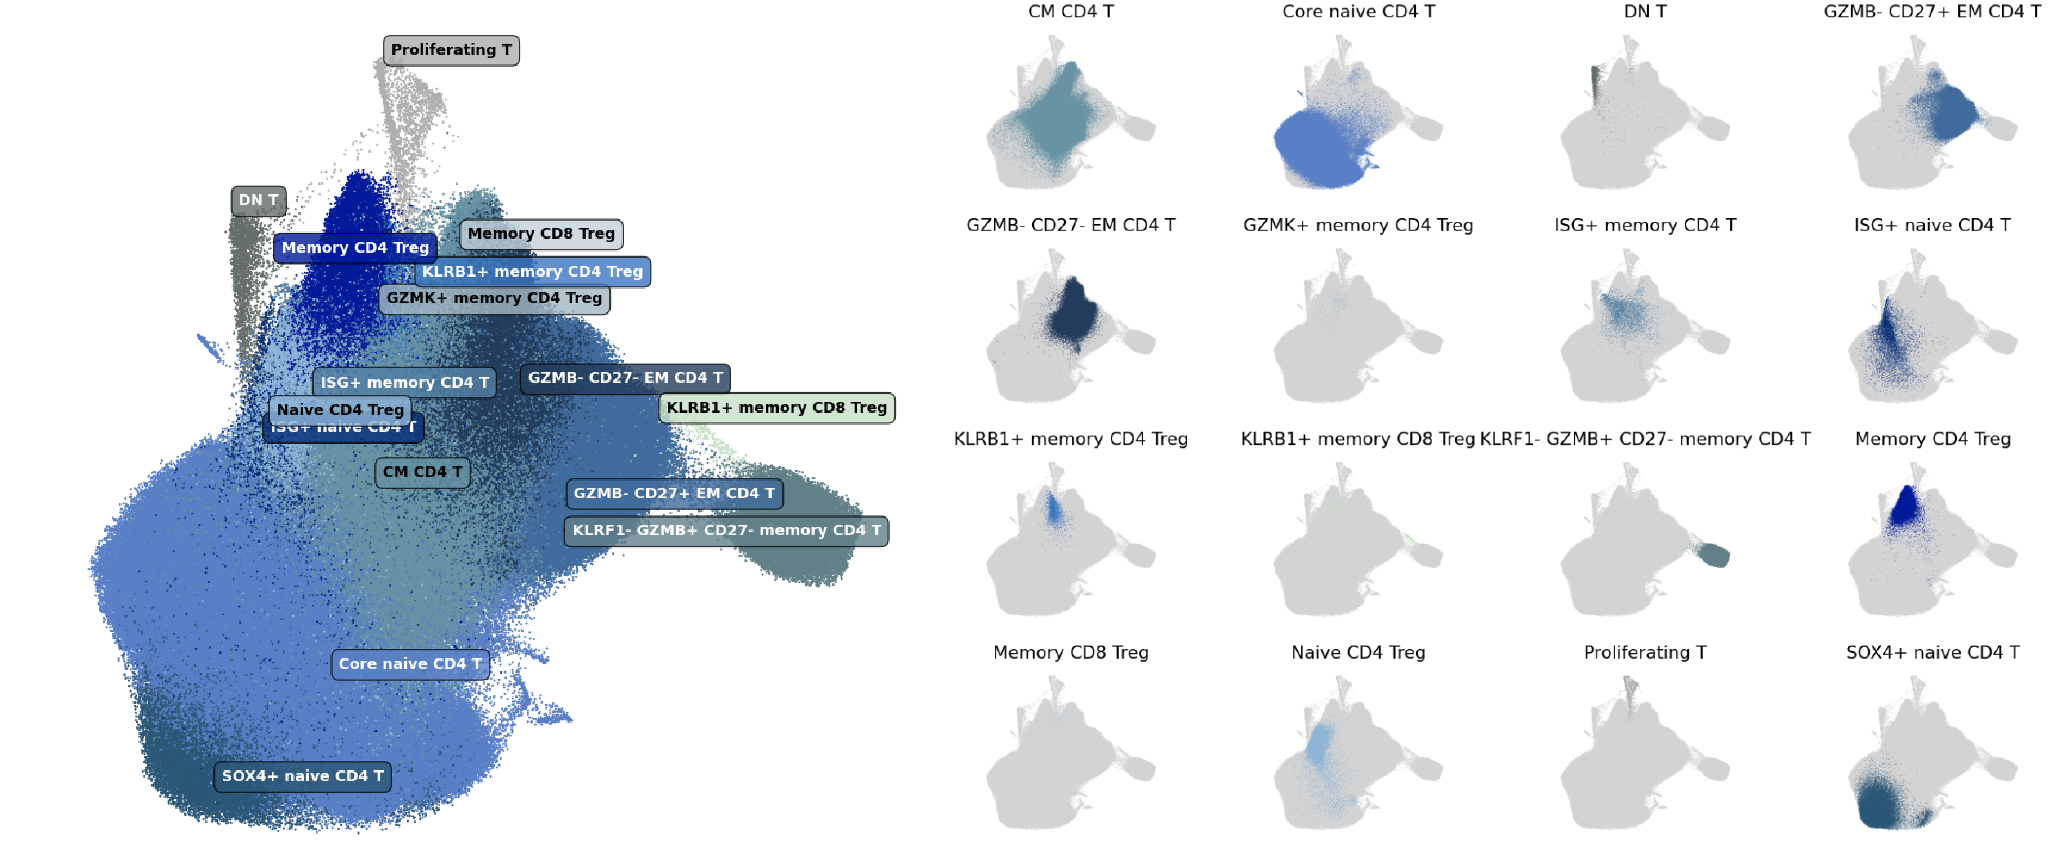
In our cell type atlas, we define CD4 T cell, Treg, and DN T cell types at 3 levels of resolution, from one Level 1 type (broadest) to 16 Level 3 types (highest resolution) based on marker gene expression and cell types previously described in literature. Note that additional cell types are also derived from the Level 1 T cell type class, and are described in a separate page for CD8, gdT, and MAIT cell types . We also include Proliferating T cells on this page, though proliferating cells include both CD4+ and CD8+ cells.
The hierarchical relationships between types, the usage of labels at each level of our cell type hierarchy, and the number and proportion of cells relative to parent populations and the full dataset (All) are shown here:
| Cell Type | Level(s) | N cells | % of Parent | % of All |
|---|---|---|---|---|
| T cell | 1 | 1,150,345 | NA | 63.15% |
| ├ Naive CD4 T cell | 2 | 378,071 | 32.87% | 20.75% |
| ┆ ├ Core naive CD4 T cell | 3 | 341,521 | 90.33% | 18.75% |
| ┆ ├ SOX4+ naive CD4 T cell | 3 | 29,411 | 7.78% | 1.61% |
| ┆ └ ISG+ naive CD4 T cell | 3 | 7,139 | 1.89% | 0.39% |
| ├ Memory CD4 T cell | 2 | 321,788 | 27.97% | 17.66% |
| ┆ ├ CM CD4 T cell | 3 | 161,769 | 50.27% | 8.88% |
| ┆ ├ GZMB- CD27- EM CD4 T cell | 3 | 67,332 | 20.92% | 3.70% |
| ┆ ├ GZMB- CD27+ EM CD4 T cell | 3 | 70,587 | 21.94% | 3.88% |
| ┆ ├ KLRF1- GZMB+ CD27- memory CD4 T cell | 3 | 17,162 | 5.33% | 0.94% |
| ┆ └ ISG+ memory CD4 T cell | 3 | 4,938 | 1.54% | 0.27% |
| ├ Treg | 2 | 39,087 | 3.40% | 2.15% |
| ┆ ├ Naive CD4 Treg | 3 | 16,948 | 43.36% | 0.93% |
| ┆ ├ Memory CD4 Treg | 3 | 17,665 | 45.19% | 0.97% |
| ┆ ├ KLRB1+ memory CD4 Treg | 3 | 2,693 | 6.89% | 0.15% |
| ┆ ├ GZMK+ memory CD4 Treg | 3 | 467 | 1.20% | 0.03% |
| ┆ ├ Memory CD8 Treg | 3 | 707 | 1.81% | 0.04% |
| ┆ └ KLRB1+ memory CD8 Treg | 3 | 607 | 1.55% | 0.03% |
| ├ DN T cell | 2, 3 | 2,349 | 0.20% | 0.13% |
| └ Proliferating T cell | 2, 3 | 2,320 | 0.20% | 0.13% |
Cell type definitions
Level 1
Here, we capture all peripheral blood mononuclear cells with a T cell identity under a single label, spanning the full spectrum of T cell maturation and differentiation. We applied our knowledge of the distinct transcriptional and phenotypic features of human T cell populations to establish a subset classification based on single cell gene expression profiles.
In this reference we have one Level 1 label:
- T cell: We distinguished T cells from other peripheral immune cell populations based on expression of T cell receptor (TCR) complex genes, including TRAC or TRDC as well as CD3 genes (CD3D, CD3E, CD3G). Of note, T cells are defined by high expression of CD3D, CD3E and CD3G, whereas NK cells express CD3E at high levels but are distinguished from T cells by low to no expression of CD3D and CD3G.
Level 2
At Level 2, we separate the T cell compartment into its major sub-subpopulations based on the expression of T cell receptor complexes (TRAC, TRDC), major co-receptors CD4 and CD8 (CD4, CD8A, CD8B) and basic gene programming. We also began to distinguish antigen-inexperienced T cell subsets, namely Naive T cells, from antigen-experienced subsets, Memory T cells.
At Level 2, we subdivided T cells into 10 major subclasses, 5 of which are described here, and 5 of which are described on a separate page.
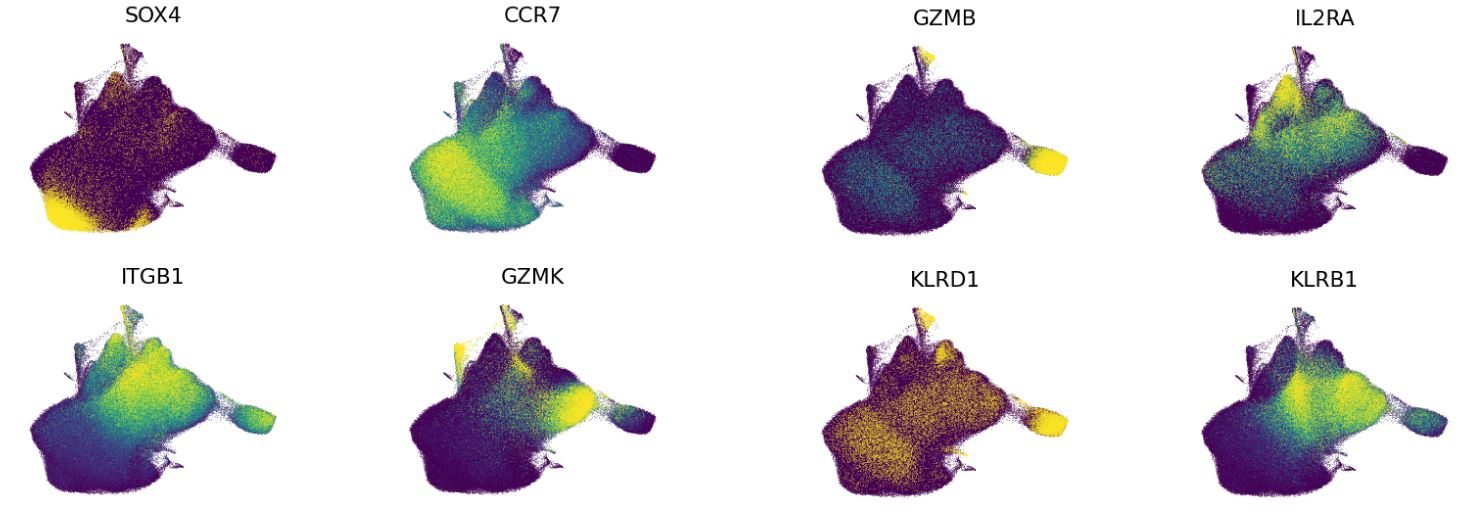
- Naive CD4 T cell: Naive CD4 T cells are an antigen-inexperienced CD4 T cell population. This population is defined by expression of CD27, CCR7, SELL, TCF7 and LEF1, and the lack of ITGB1, an integrin specifically expressed on memory T cells.
- Memory CD4 T cell: Memory CD4 T cells arise when Naive CD4 T cells encounter their cognate antigen and receive further activating signals, which support differentiation. This population is delineated in scRNA-seq by the expression of ITGB1.
- Treg: Regulatory T cells (Tregs) are a population of T cells that help tune down or suppress immune responses. This population is defined by the expression of FOXP3, IL2RA, IKZF2 and RTKN2.
- DN T cell: Double-negative (DN) T cells are defined as alpha-beta T cell populations (expressing TRAC) that lack the expression of CD4, CD8A and CD8B.
- Proliferating T cell: Proliferating T cells are defined as alpha-beta or gamma-delta T cell populations that express genes indicative of cell cycling, including MKI67. This is a mixed population of T cells undergoing a common functional process.
Level 3
At Level 3 of our annotations, we further divided the Naive CD4, Memory CD4, and Treg cells based on expression of specific gene programs. DN T cells and Proliferating T cells were not subdivided further.
Naive CD4 T cells were divided into 3 subpopulations:
- Core naive CD4 T cell: Core naive CD4 T cells are the major antigen-inexperienced CD4 T cell population. This population is defined by expression of CD27, CCR7, SELL, TCF7 and LEF1, and the lack of ITGB1, an integrin specifically expressed on memory T cells.
- SOX4+ naive CD4 T cell: This Naive CD4 T cell population is delineated from Core Naive CD4 T cell by a bias towards an immature T cell gene expression profile, in particular SOX4.
- ISG+ naive CD4 T cell: This Naive CD4 T cell population is delineated from Core Naive CD4 T cell by the expression of type-I interferon signaling genes (ISG), such as MX1 and IFI44.
Memory CD4 T cells were divided into 5 subpopulations based of expression of CD27, GZMK, GZMB, and KLRF1:
- CM CD4 T cell: Central memory (CM) CD4 T cells are a memory T subset defined by high expression of CCR7, SELL, and LEF1 compared with other memory CD4 T cell populations.
- GZMB- CD27- EM CD4 T cell: This memory CD4 T cell population is defined by low expression of CCR7, SELL, and LEF1, as well as low GZMA and no GZMK or GZMB expression.
- GZMB- CD27+ EM CD4 T cell: This memory CD4 T cell population is defined by expression of CD27 and GZMK in the absence of GZMB expression and low CCR7, SELL, and LEF1 expression.
- KLRF1- GZMB+ CD27- memory CD4 T cell: This memory CD4 T cell population is defined by high expression of GZMB and CCL5 with no KLRF1, CD27, or GZMK expression. This subset is closely associated with GZMB+ CD27- EM CD8 T cells.
- ISG+ memory CD4 T cell: This memory CD4 T cell population is delineated from other memory CD4 T cells by the expression of type-I interferon signaling genes (ISG), such as MX1 and IFI44.
Tregs were divided into 6 subpopulations:
- Naive CD4 Treg: Naive CD4 regulatory T cells (Treg) are an antigen-inexperienced CD4 Treg population. This population is defined by expression Treg markers with additional expression of CD27, CCR7, SELL, TCF7, and LEF1, and the lack of ITGB1, an integrin specifically expressed on memory T cells.
- Memory CD4 Treg: Memory CD4 regulatory T cells (Treg) arise when Naive CD4 Tregs encounter their cognate antigen and receive further activating signals, which support differentiation. This population is delineated in scRNA-seq by the expression of ITGB1.
- KLRB1+ memory CD4 Treg: This memory CD4 Treg population is delineated from Memory CD4 Tregs by a more innate-like gene expression profile including KLRB1 but not GZMK.
- GZMK+ memory CD4 Treg: This memory CD4 Treg population is delineated from Memory CD4 Tregs by the expression of GZMK but not KLRB1.
- Memory CD8 Treg: This memory Treg population is delineated from Memory CD4 Tregs by the expression of CD8A and not CD4.
- KLRB1+ memory CD8 Treg: This memory CD8 Treg population is delineated from Memory CD8 Tregs by the expression of KLRB1.
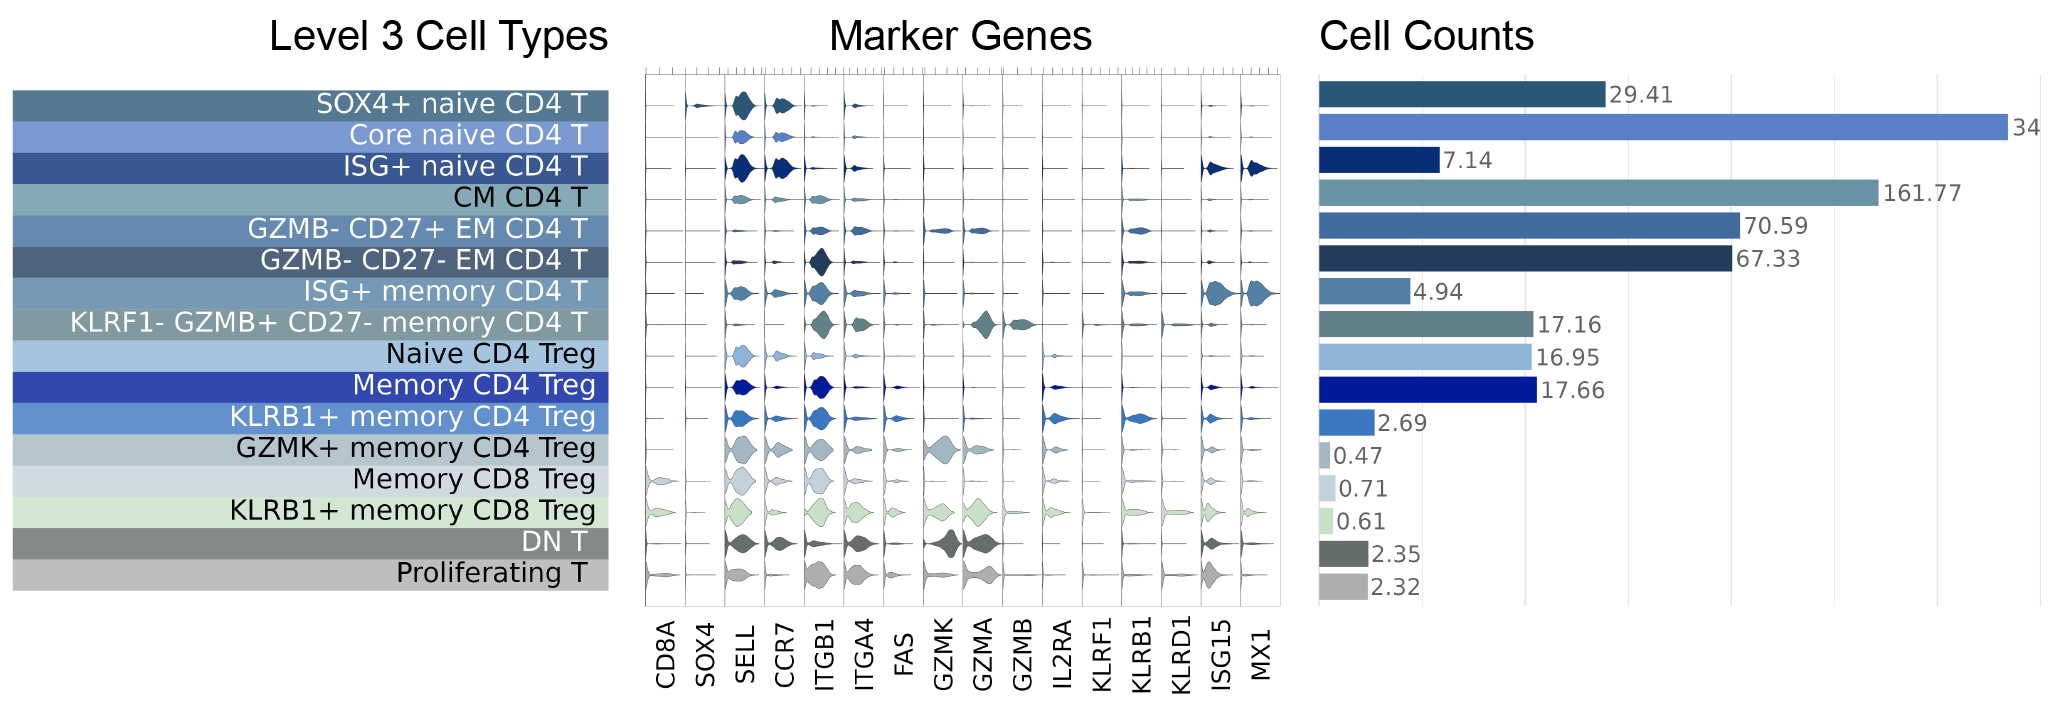
Marker visualizations
Key markers used to define NK and ILC cell types are shown in this figure, where we display a violin plot for each marker gene and each Level 3 cell type:
Expression of key marker genes shown on our UMAP projection: