Last modified 2025-10-03 |
Explore Traceable Workflow Data in CertPro (Tutorial)
| CertPro | Certificate of Reproducibility |
| HISE | Human Immune System Explorer |
| IDE | integrated development environment |
At a Glance
New workflow features in CertPro let you examine the provenance and dependencies of each asset as your analysis progresses. Each node (vertex) in the CertPro graph represents a traceable data asset—such as a file, fileset, or IDE instance. The TRACEABILITY tab offers direct links to each asset's immediate upstream sources and downstream outputs. This workflow-centric traceability helps you verify sources, understand relationships, maintain transparency, and ensure reproducibility. In this tutorial, we show you how to explore and expand traceable connections throughout your analysis.
Walk the Graph
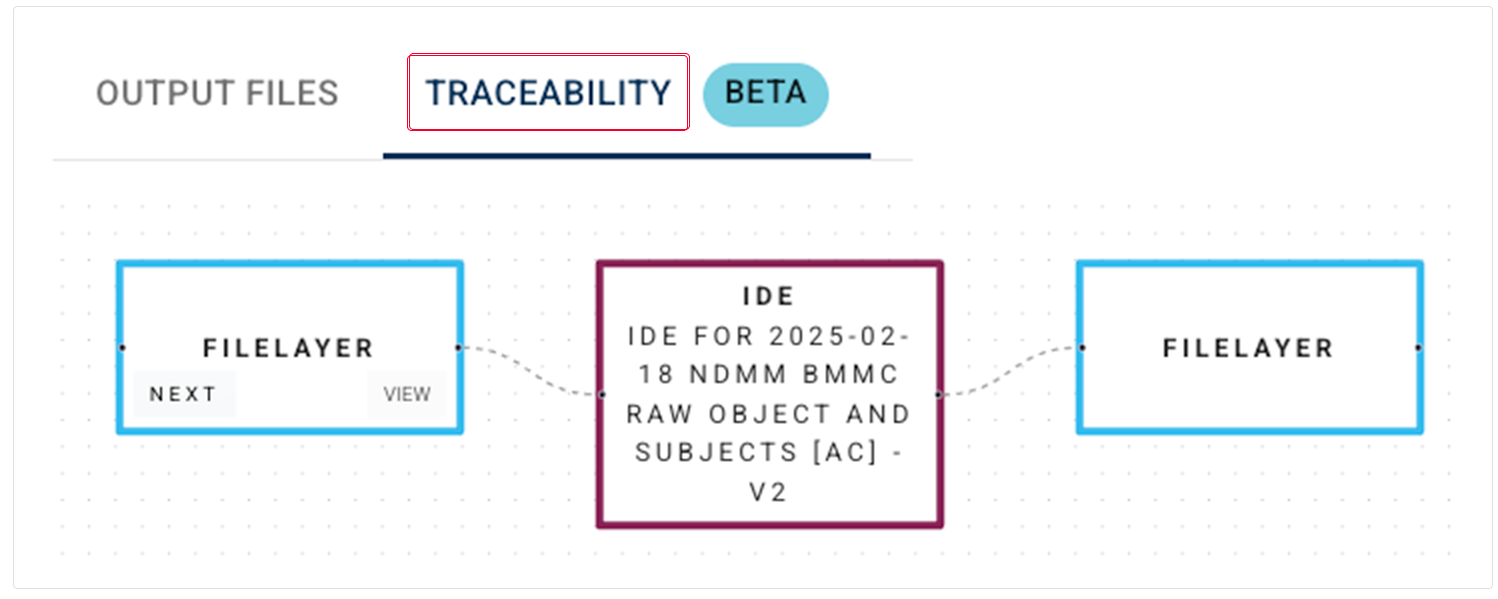
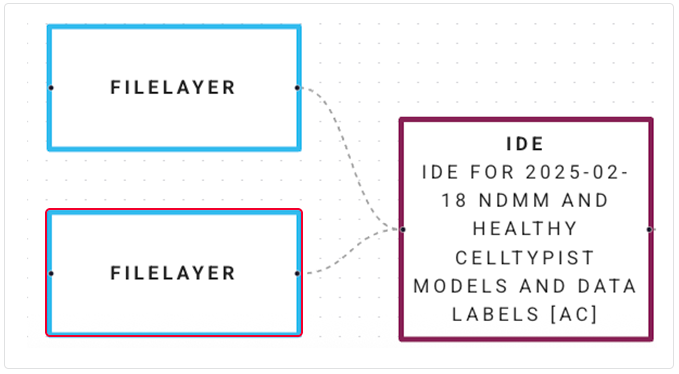
In CertPro, an asset node represents a file, fileset, or IDE. Each node is visually linked to its upstream and downstream neighbors by a set of moving dotted lines, or “marching ants.” A static image appears below. To see the marching ants in action, view the finished CertPro certificate in the Human Immune Health Atlas.
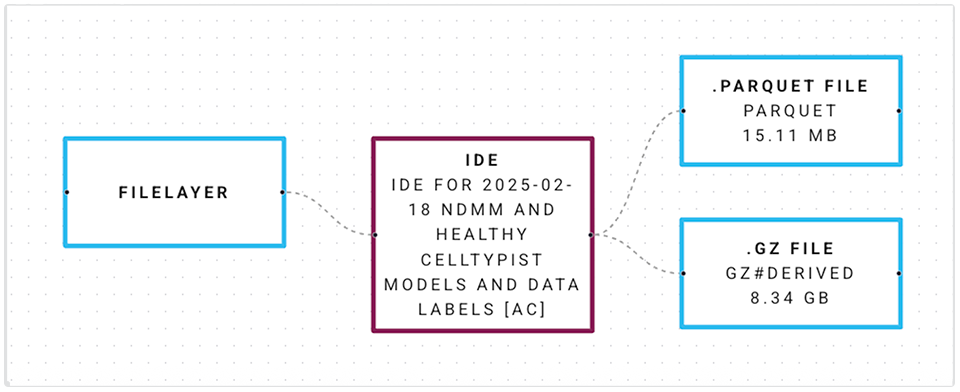
These animated connections represent the flow of data and show relationships between and among assets. The movement of the lines indicates that the relationships are active and traceable in the graph—you can follow the trail to "walk the graph"–that is, to see data lineage at every step. Each line in the identifies the type of relationship it represents:
- A data transformation (“processed by SampleIDE v1.2”)
- An input or output association (“used as input,” “produced as output”)
- A provenance step (“derived from sample S1234,” “uploaded by user A”)
You must embed metadata, such as file origin, sample/case associations, and environment, during the ingestion process. Ensure that your filesets and files are correctly cataloged. Any errors can break the trace downstream in your CertPro graph. Add relevant sample and cohort references during upload for correct trace lineage. For details, see Attach Metadata to Make Files Searchable (Tutorial).
Instructions
 Upload and Ingest Data for Traceability
1. Navigate to HISE, and use your organizational email address to sign in.
2. Use the project store or SDK methods to upload raw data files, processed datasets, or derived analysis results to your study space. For details. see Use the Upload Files SDK Method (Tutorial), Use Watchfolders to Ingest Data (Tutorial), and Ingest Data into the Project Store (Tutorial).
3. Go to COLLABORATION SPACE > Studies > [Your Study], and use the side navigation links to verify your file uploads.
 Review the OUTPUT Tab
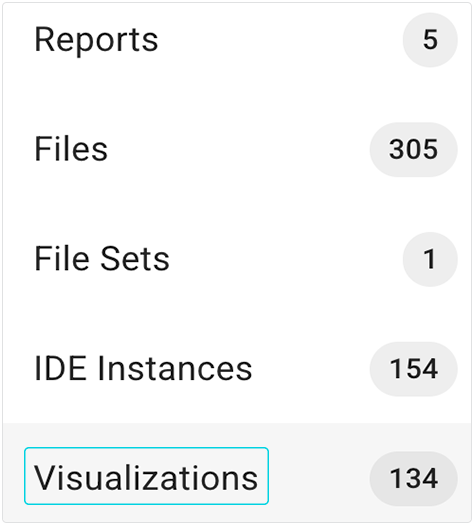
1. There are two ways to find the OUTPUT and TRACEABILITY tabs for your CertPro assets—that is, visualizations, files, file sets, and IDE instances. (Reports are considered study assets, but they're a means of presenting information and are not traced in CertPro.) The OUTPUT tab might be called something else, such as FILES, depending on the asset type.
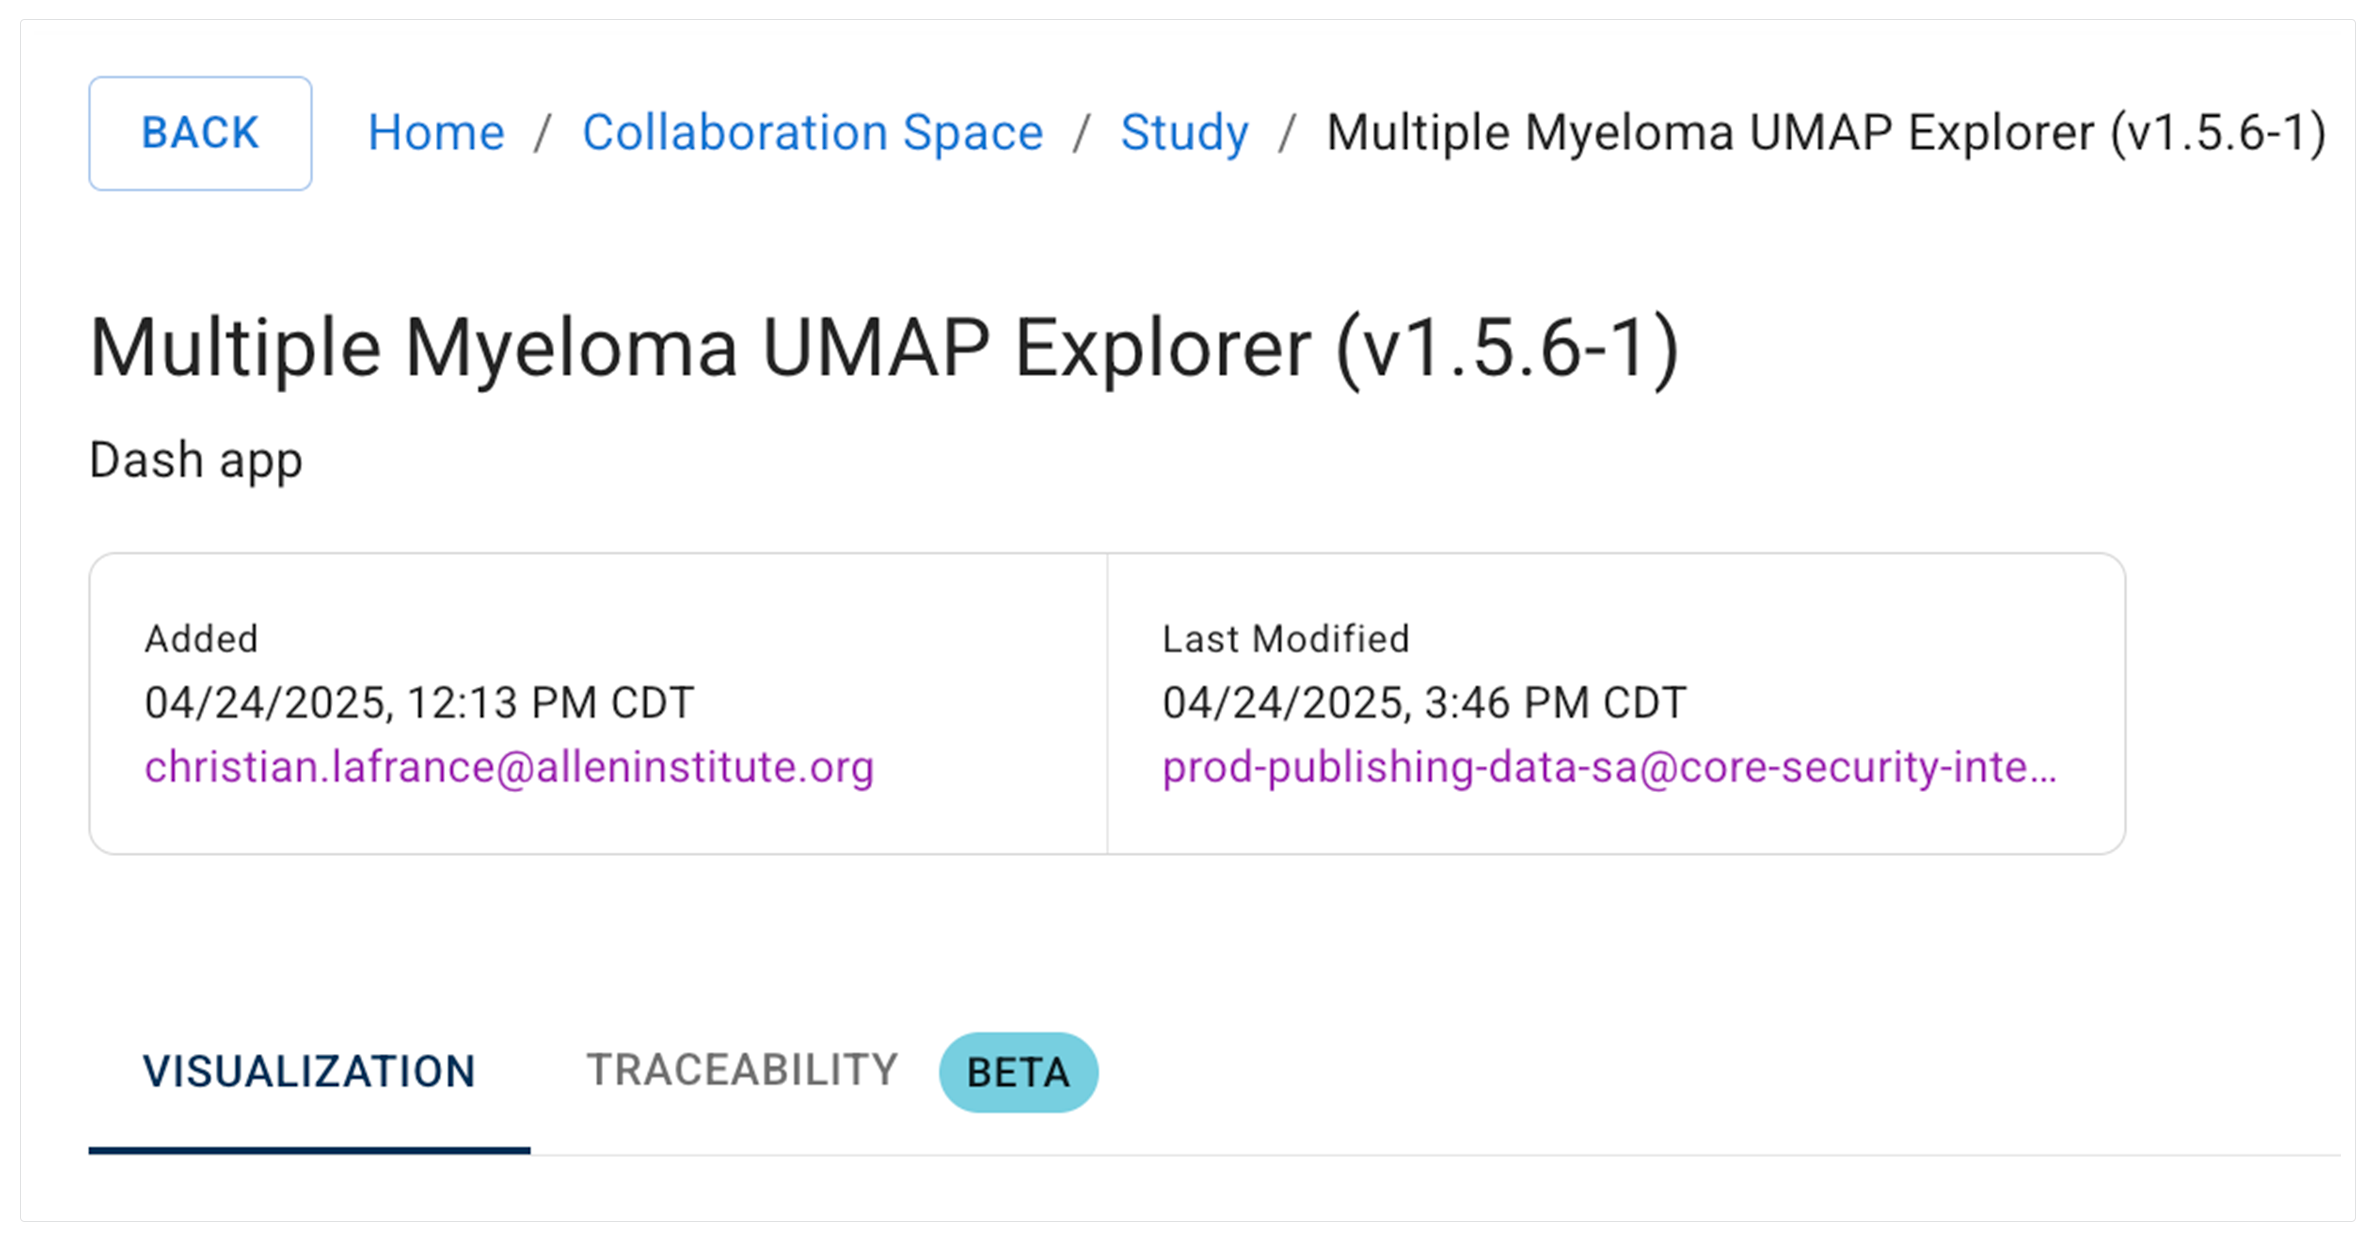
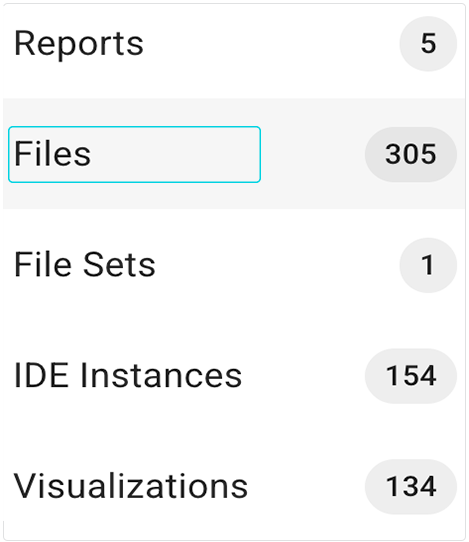
A. Click the side navigation link for the type of asset you want to examine, such as a visualization.
i. Click the card for the visualization whose tabs you want to see.
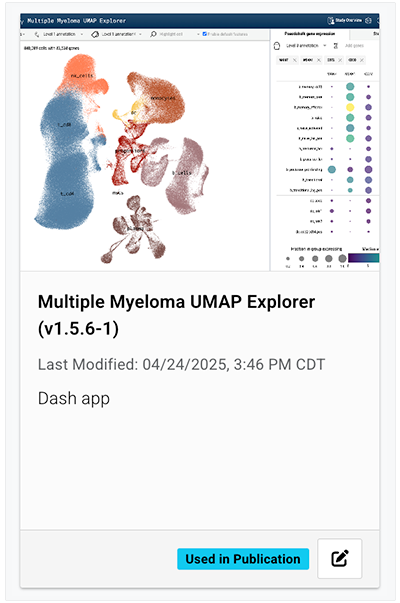
ii. The VISUALIZATION (OUTPUT)and TRACEABILITY tabs appear.
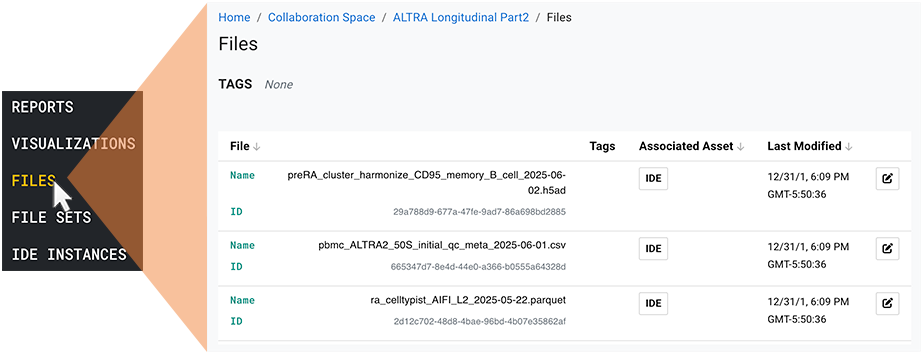
B. Alternatively, to view the OUTPUT and TRACEABILITY tabs for Files or File Sets, use the side navigation menu.
i. Click FILES or FILE SETS.
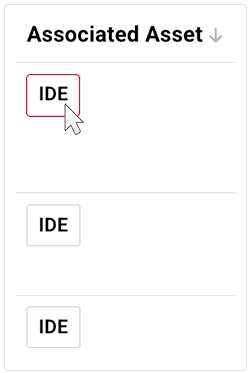
ii. In the Associated Asset column, click the asset type for the file whose tabs you want to see.
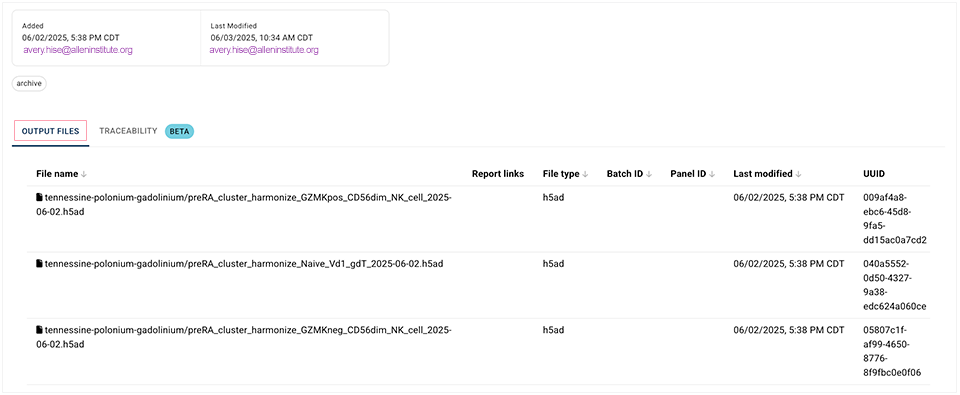
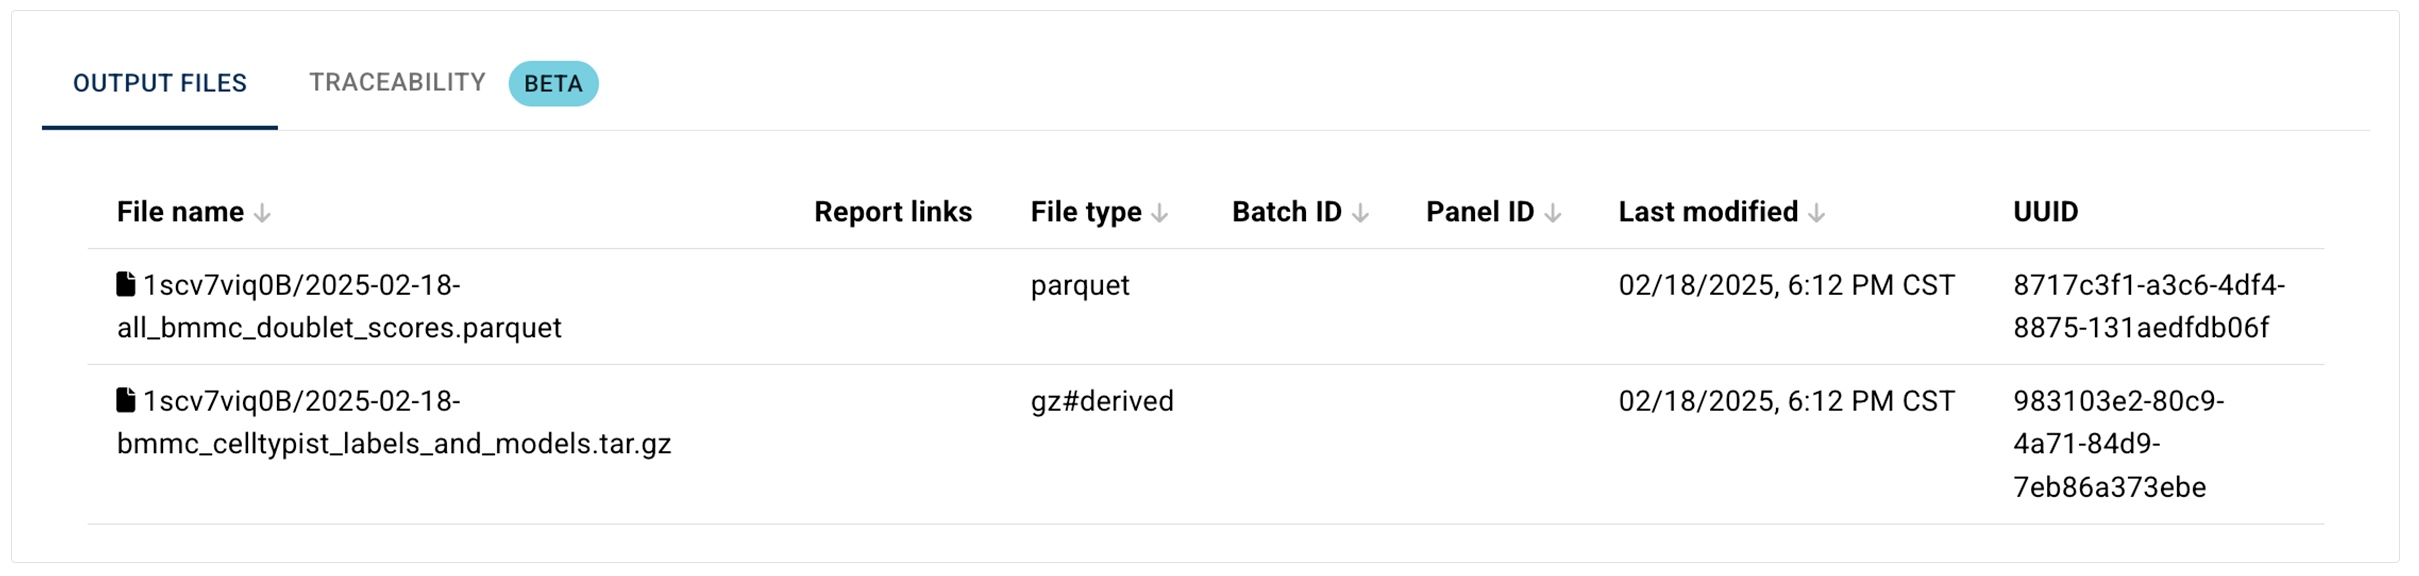
iii. On the OUTPUT FILES tab, review your files.
 Review the TRACEABILITY Tab
1. To see the CertPro node that corresponds to the selected asset, as well as nodes representing the associated input files, click TRACEABILITY.
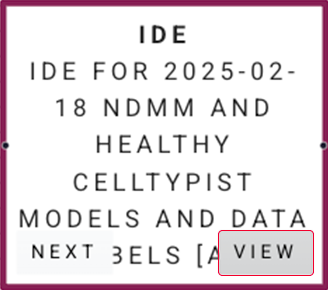
A. To see all content, metadata, provenance, downstream connections, and actions for the specified asset, hover over the lower-right corner of the node and click VIEW.
i. The detail page for the selected asset opens on the OUTPUT FILES tab.
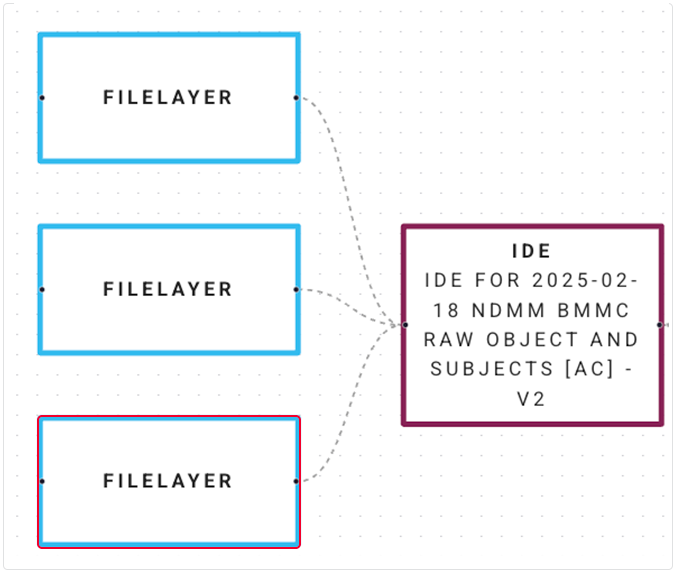
B. To see additional upstream or downstream data connected to the current node, click NEXT.
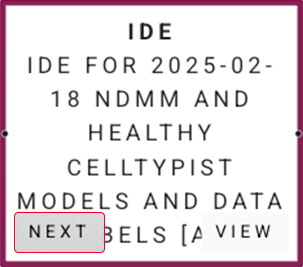
i. The graph recenters on the new node, allowing you to step through the trace and investigate data provenance or downstream results by revealing only the next level (a partial graph) instead of displaying the entire graph at once.
ii. Click Next again, and yet another layer appears. You can keep walking the graph this way until there are no more assets to display.
iii. To move the graph to a different position on the screen, use the hand (pan) tool. Click the graph, hold it, drag it to a new position, and release.
 Related Resources
Create and Use Certificates of Reproducibility (Tutorial)