Last modified 2026-03-31 |
|
Use Advanced Filters for Complex Search Queries (Tutorial)
| Abbreviations Key |
EMR | electronic medical record |
GUID | globally unique identifier |
Human Immune System Explorer | |
IDE | integrated development environment |
QC | quality control |
At a Glance
Use this tutorial when you want to answer a precise research question in HISE. We show you how to move beyond quick, broad searches (for example, project plus file type, or a known file name) to layer on specific metadata filters that pinpoint the files, samples, cohorts, or public data you need. You can also run multiple queries, group the results of each query, and display them in a visualization tool to compare attributes such as cohorts, visits, or pipelines. We explain when and how to use advanced filters to execute complex queries in HISE Advanced Search.
For instructions on performing simple searches, see Use Advanced Search for Basic Queries (Tutorial). If you have questions or need help, contact Support.
Description
Instructions
Step 1: Set up search
Step 2: Apply filters
Step 3: Choose operator and value
Step 4: Use results
Step 5: Example: Combine batch ID and sample kit GUID filters
Related Resources
Description
The redesigned HISE Advanced Search lets you use an intuitive, shopping‑style interface to find the data you need for your research. You define the search scope, pick a category (files, samples, EMR, or public files), and apply filters that behave like selections in an online store. As you narrow your results, more granular, context‑specific filters appear to help you refine your data set by attributes such as batch or panel ID, visit, and cohort. Using these filters makes it easy to reproduce an analysis data set, limit results to a particular disease state or visit window, or pull files tied to a known subject, specimen, or file ID. The next section walks through these steps so you can apply them to your own searches.
Instructions
 Set up search
For details on Step 1, parts 1–3, see Use Advanced Search for Basic Queries (Tutorial).
1. Sign in to HISE, and choose a general search type: FILES, SAMPLES, EMR, or PUBLIC FILES.

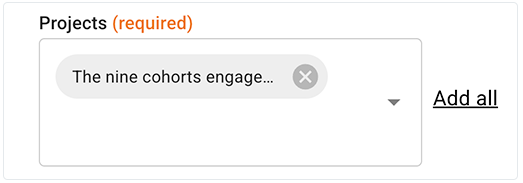
2. Choose one or more projects.
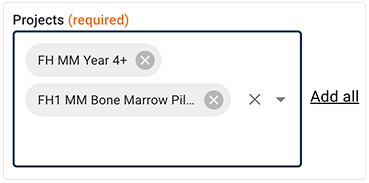
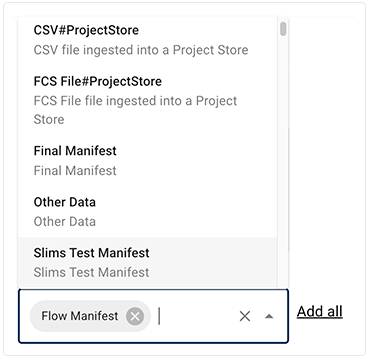
3. (FILES searches only.) Choose one or more file types.
 Apply filters
1. To apply filters to your search, choose among the following categories: Sample Metadata, File Metadata, Subject Metadata, User Tags, Custom Metadata, Survey Metadata, EMR Data, EMR Metadata, and Lab Metadata.
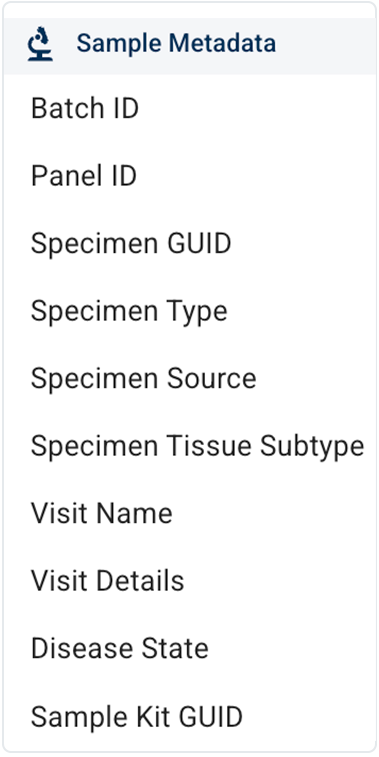
A. Sample Metadata filter group. This filter group pinpoints specimen-level attributes for each sample. Use it to find samples with specific processing histories or biological characteristics.
Sample Metadata filter group | ||
| Filter | Description |
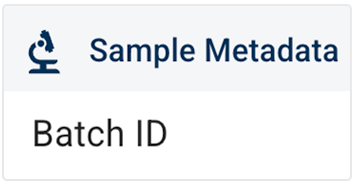
| Batch ID | Unique pipeline batch identifier for processed samples. |
Panel ID | Assay or marker panel configuration identifier. | |
Specimen Type | High-level specimen category (for example, "Blood"). | |
Specimen Source | Anatomical or biological origin of the specimen. | |
Specimen Tissue Subtype | More specific tissue classification within the source. | |
Visit Name | Study-defined label for the collection event. | |
Visit Details | Additional scheduling or context notes about the visit. | |
Disease State | Clinical or experimental disease condition at collection (for example, "Healthy control."). | |
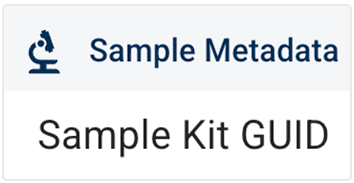
Sample Kit GUID | Globally unique ID of the physical collection kit. |
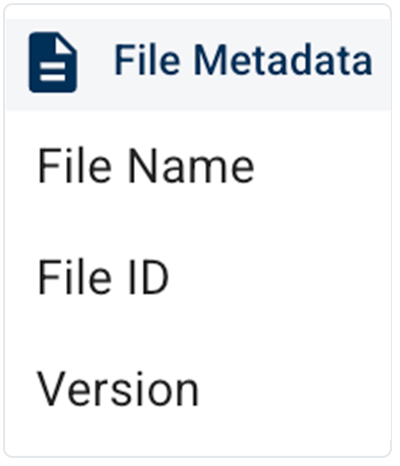
B. File Metadata filter group. This filter group represents properties of stored files. Use it to find results based on how files were generated, stored, or labeled.
File Metadata filter group | ||
| Filter | Description |
| File Name | Human-readable name of the stored file. |
File ID | Unique system identifier for the file record. | |
File Version | Specific revision number of the file content. |
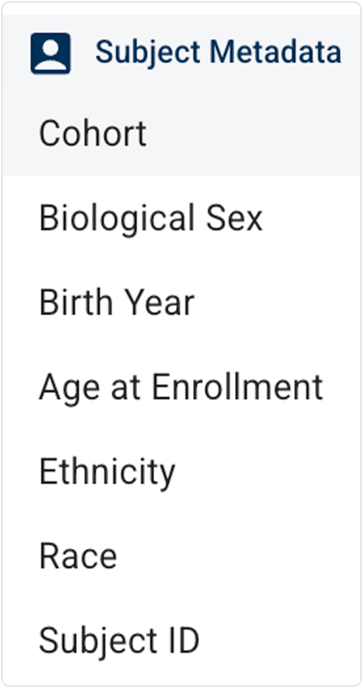
C. Subject Metadata filter group. This filter group targets subject-level information. Use it to find data associated with subjects who share specific characteristics.
Subject Metadata filter group | ||
| Filter | Description |
| Cohort | Study-defined group to which the subject is assigned. |
Biological Sex | Subject's sex assigned at birth. | |
Birth Year | Calendar year in which the subject was born. | |
Age at Enrollment | Subject’s age when first enrolled in the study. | |
Ethnicity | Subject's self-reported ethnic background. | |
Race | Subject's self-identified racial category. | |
Subject ID | Subject's study-specific identifier. |
D. User Tags filter group. This filter group maps to user-defined labels attached to files or records, such as custom names, versions, groups, or origins. Use them to quickly find or regroup data according to a project-specific tagging scheme.
User Tags filter group | ||
| Filter | Description |
Details | Freeform notes about the user tag. | |
Name | User-defined tag name or label. | |
Version | Version identifier for this specific tag definition. | |
Group | User-defined grouping or cohort label. | |
Origin | Source or provenance of the tagged data. | |
Other | Miscellaneous user-defined tag not elsewhere covered. |
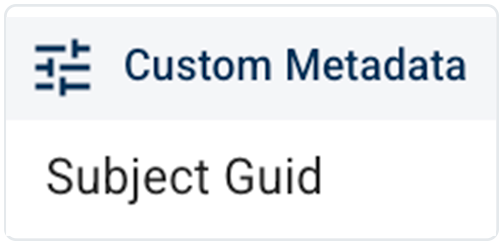
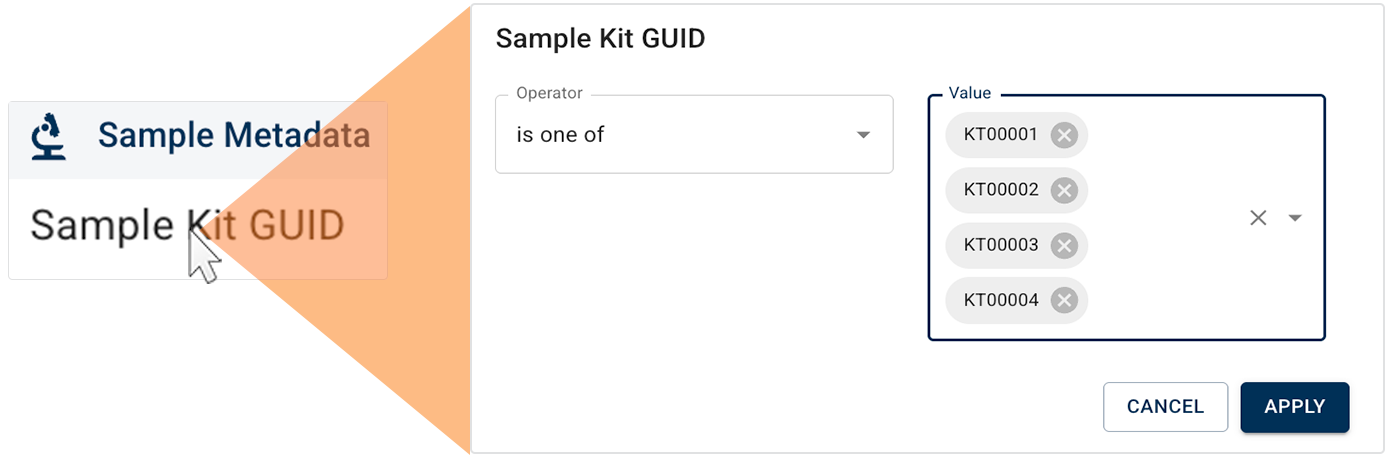
E. Custom Metadata filter group. This filter group covers project-specific fields that extend the standard metadata model, such as additional diagnoses, external IDs, or study-specific flags. Use these filters to search fields not covered by the standard sample, file, or subject filters.
| ||
The Custom Metadata filter group appears only when your current query context includes data that requires custom fields. When this filter does appear, it might not include all three options listed in the accompanying table. For example, as shown in the image to the left of the table, the query produced only one custom filter option. | ||
Custom Metadata filter group | ||
| Filter | Description |
| Diagnosis | Documented clinical diagnosis for the subject at collection. |
limsParentContentID | Identifier linking this record to its parent LIMS entry. | |
Subject Guid | Globally unique identifier for the study subject. |
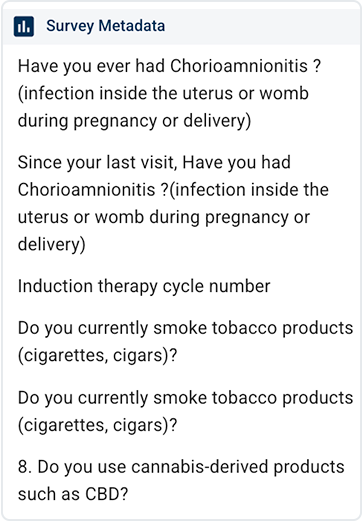
F. Survey Metadata filter group. Selections in the Survey Metadata filter group vary widely. They describe the respondents who participated in a survey and the survey context, such as when and how the data collection occurred and what questions were asked. This filter does not include survey responses.
Back to top
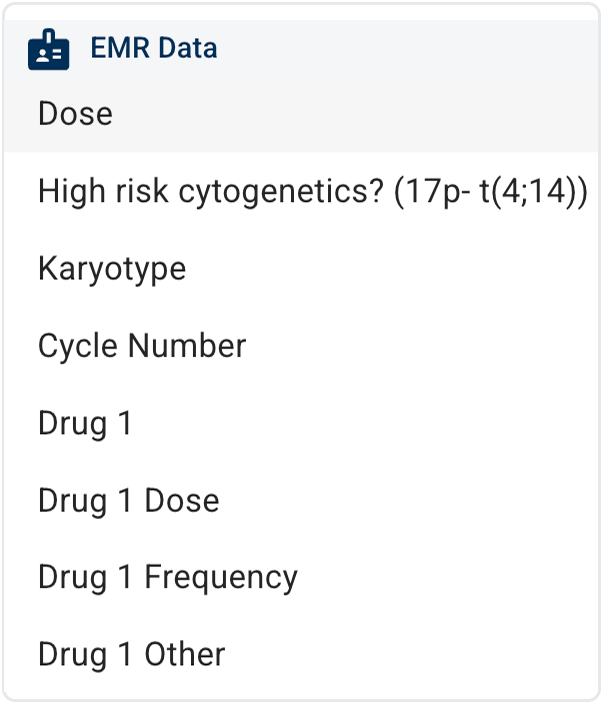
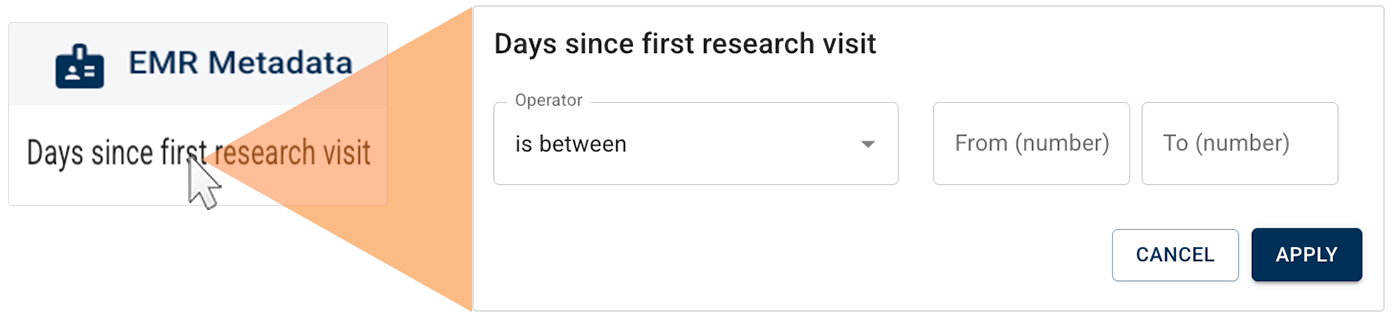
G. EMR Data filter group. This highly variable filter group consists of dynamically generated, structured clinical fields from the EMRs associated with your selected projects. Examples include specific diagnoses, lab values, and treatment attributes. These filters are used to find data associated with specific subjects or samples.
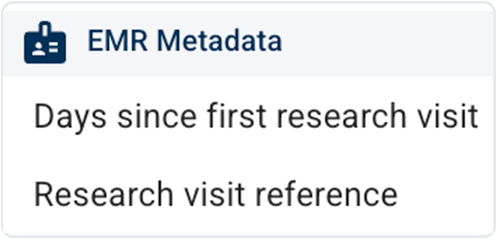
H. EMR Metadata filter group. This group captures various descriptive fields, such as file IDs, dates, and linkage keys, associated with EMR records. Use this filter group to find data based on how or when it was ingested or categorized.
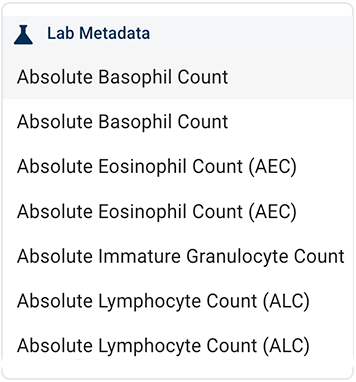
I. Lab Metadata filter group. This group narrows your results based on laboratory measurements and derived lab values, such as absolute basophil, eosinophil, or lymphocyte counts. These filters help you find records for subjects or samples with specific lab profiles or ranges that matter for your analysis.
 Choose operator and value
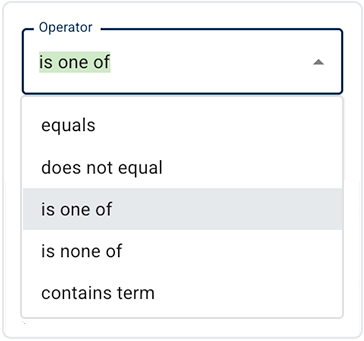
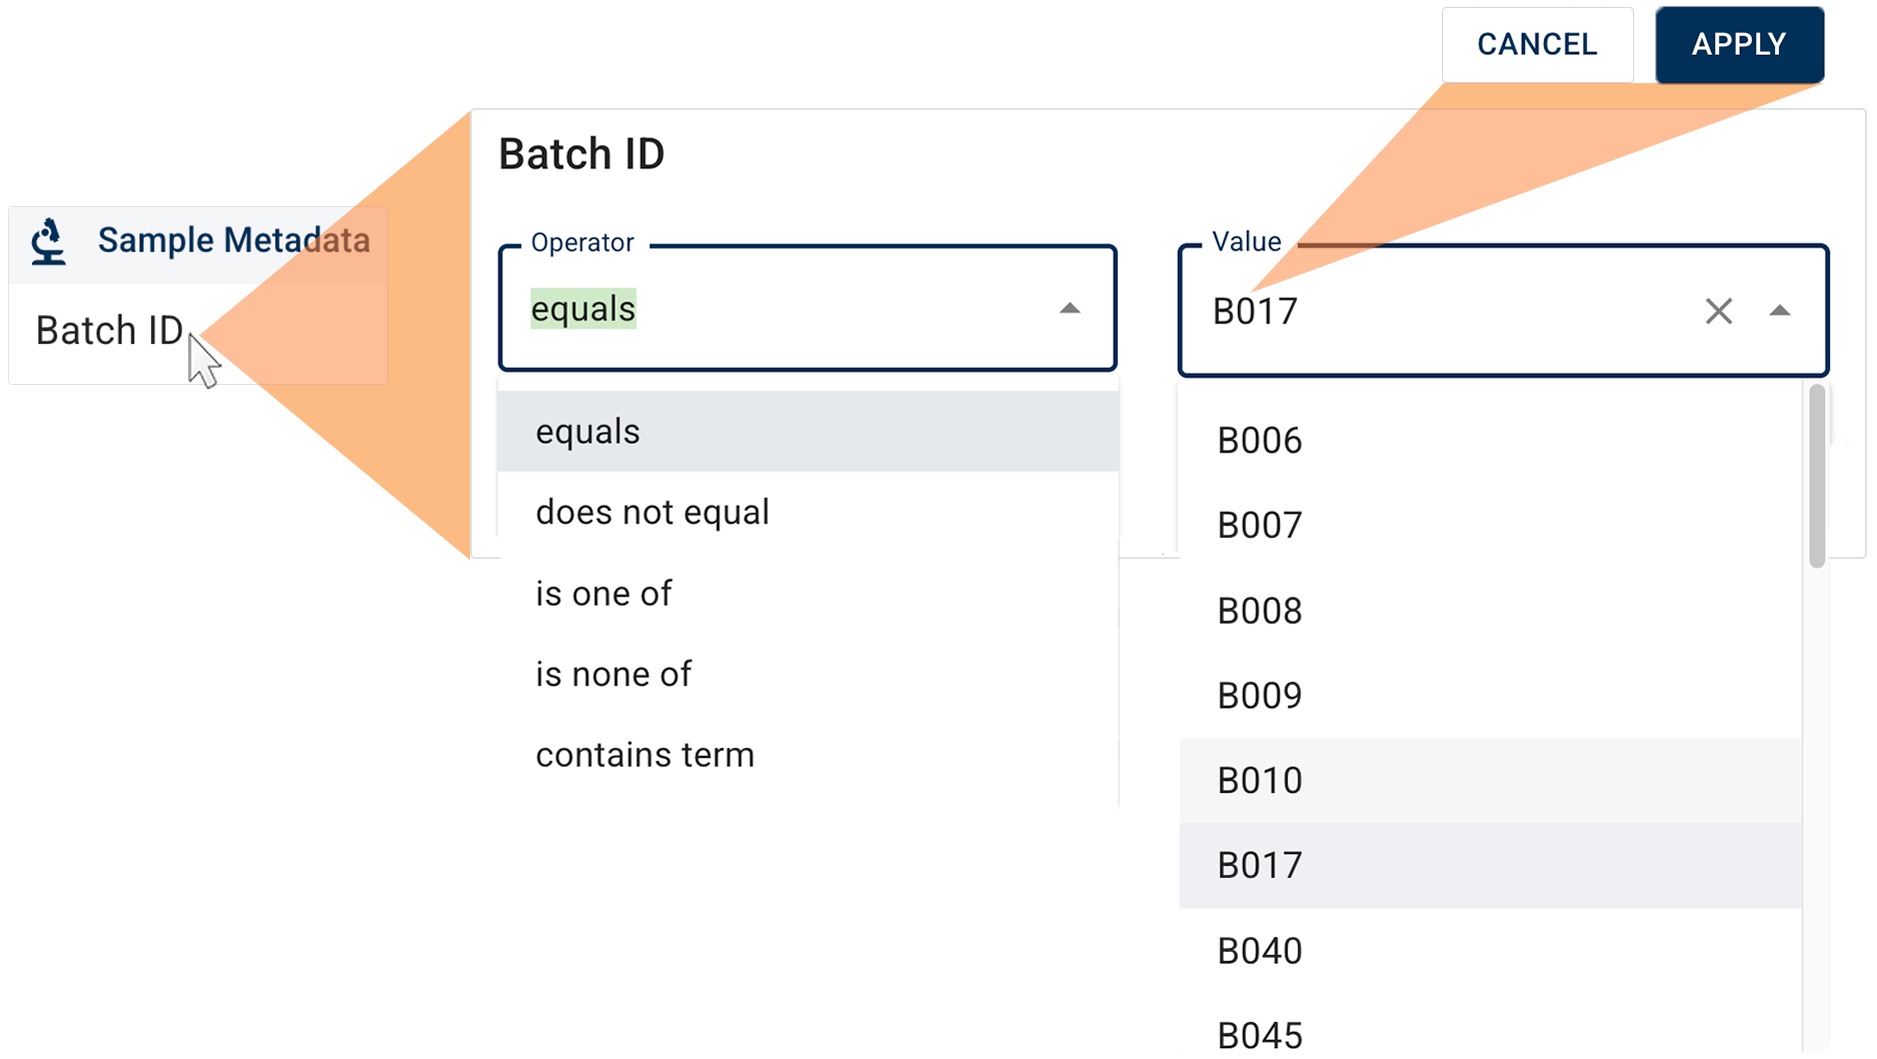
1. After each filter selection, click the arrow to the right of the Operator field and choose an operator from the drop-down list (see the images and the accompanying table). Operators, like filters, are context specific, so the operators available to you depend on the filter you select.
A. The is one of and is none of operators let you use multiple-select to choose more than one value.
B. Some operators, such as is between, let you specify a range of values (between x and y).
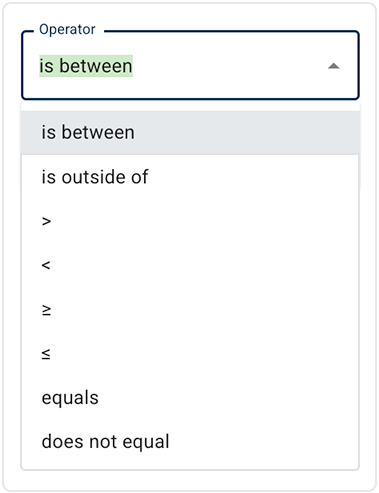
Filter operators | |||
Operator | Description | Multiple-select allowed | Range of values allowed |
equals | A single, exact value. |
|
|
does not equal | Excludes one specific value. |
|
|
is one of | Returns records in which the selected filter matches any of the specified values. |
|
|
is none of | Excludes all selected values. |
|
|
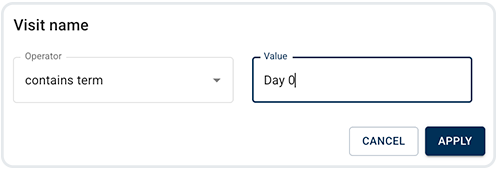
contains term | Type a keyword or phrase (for example, FH 1013) into the Value field. |
|
|
is between | Returns a specified range of values (between x and y). |
|
|
is outside | Returns a value outside the specified range. |
|
|
Returns a value greater than the specified number. |
|
| |
Returns a value less than the specified number. |
|
| |
Returns a value greater than or equal to the specified number. |
|
| |
Returns a value greater less than or equal to the specified number. |
|
|


2. Click the arrow to the right of the Value field, and choose a value from the drop-down list. In some cases, the Value field becomes a text box, and you can type a value directly into it.
3. In the results window, select the checkbox next to each result you want to include in your data set. To keep all results, click SELECT ALL ITEMS. To see the number of rows selected, check the lower-right corner of the table.
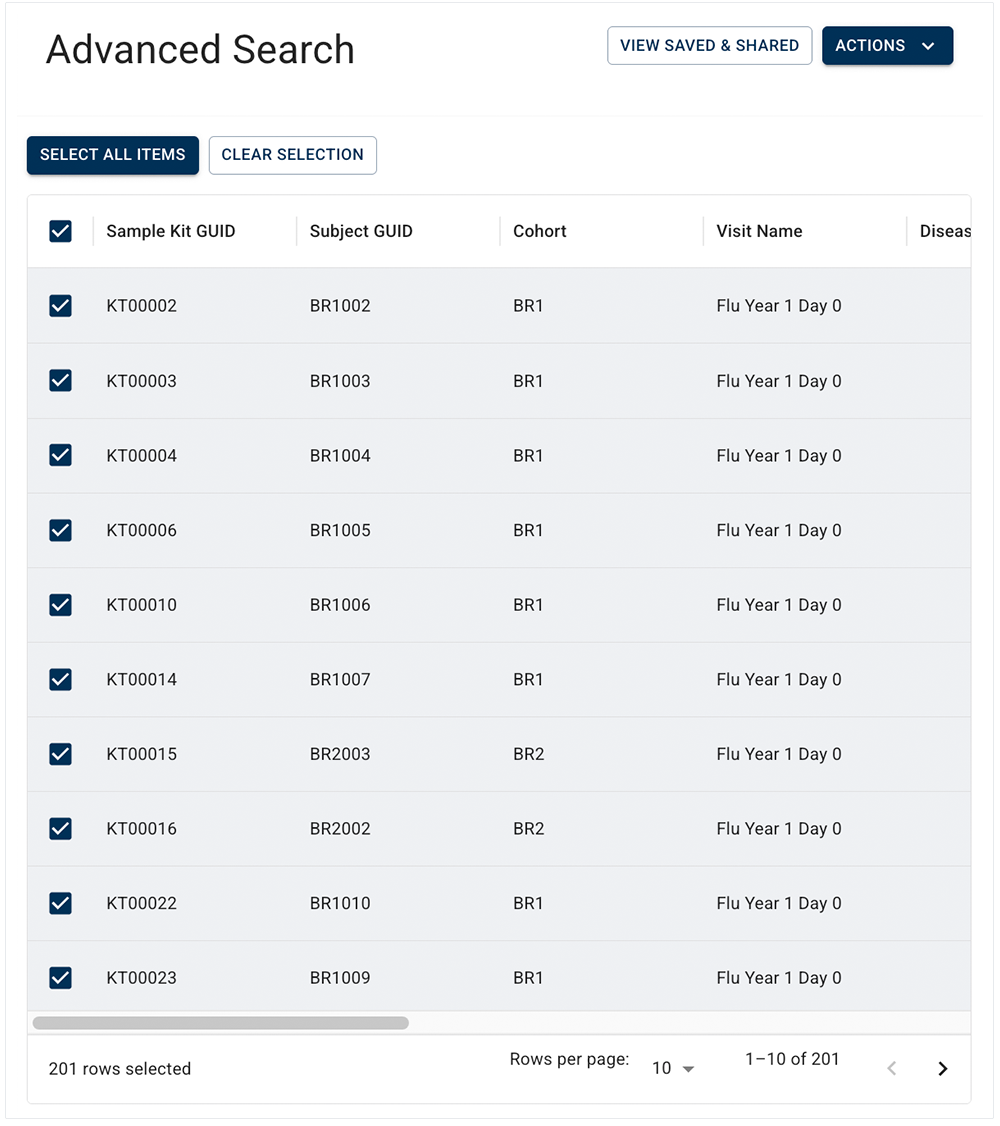
4. To keep the results that appear in the results window, click APPLY. To return to filter selection, click CANCEL.
|
The results shown in the results window change instantly as you select operators and values. The options that appear in the drop-down list of values are limited by your earlier project, file type, and filter selections. If a query returns no matches or too few matches, thinking in terms of filter groups and operators, rather than tweaking single terms, often yields better results. If you choose an operator and the Value returns |
 Use results
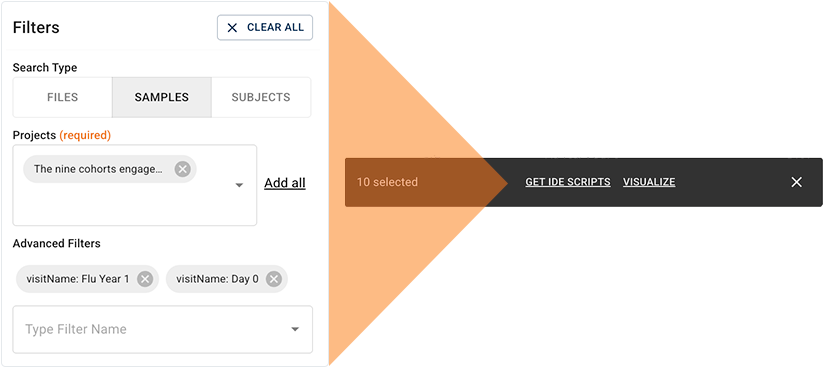
1. From the floating options menu, click the link that represents what you want to do with your results. For details, see the accompanying table.
|
|
The options menu for your result set is context specific and, as a result, it might not contain all the options described in the Floating Options Menu table below. For example, the search shown here produces only two options: GET IDE SCRIPTS and VISUALIZE. You can load your results into an IDE or create a visualization, but you can't use the results to create or expand a file set. |
|
Floating options menu | ||
| Option | Description | |
 | ADD TO FILE SET | Use this option to add the selected items to an existing file set that you choose from the Options menu. You can reuse the same collection of files in analyses, visualizations, or Data Apps. For details, see Work with File Sets (Tutorial). |
 | CREATE FILE SET | Use this option to create a new file set from the selected items. Track and share exactly which samples, subjects, or files you plan to analyze. For details, see Save Your Input File or File Set to a Study (Tutorial). |
 | GET IDE SCRIPTS | Use this option to generate and download scripts you can run in a supported IDE. Load the selected results as an input dataset for modeling, differential analysis, or QC. For details, see Attach an IDE to a Study (Tutorial). |
 | VISUALIZE | Use this option to pass an Advanced Search result set into a HISE visualization template or your own Python/R notebook. Build plots, dashboards, and interactive figures you can reuse across studies. For details, see Use the HISE SDK to Build and Save Visualizations (Tutorial). You can also add visualizations to Data Apps or publications. For details, see Get Started with Data Apps (Tutorial) and Prepare a Publication (Tutorial). |
 (Optional) Example: Combine batch ID and sample kit GUID filters
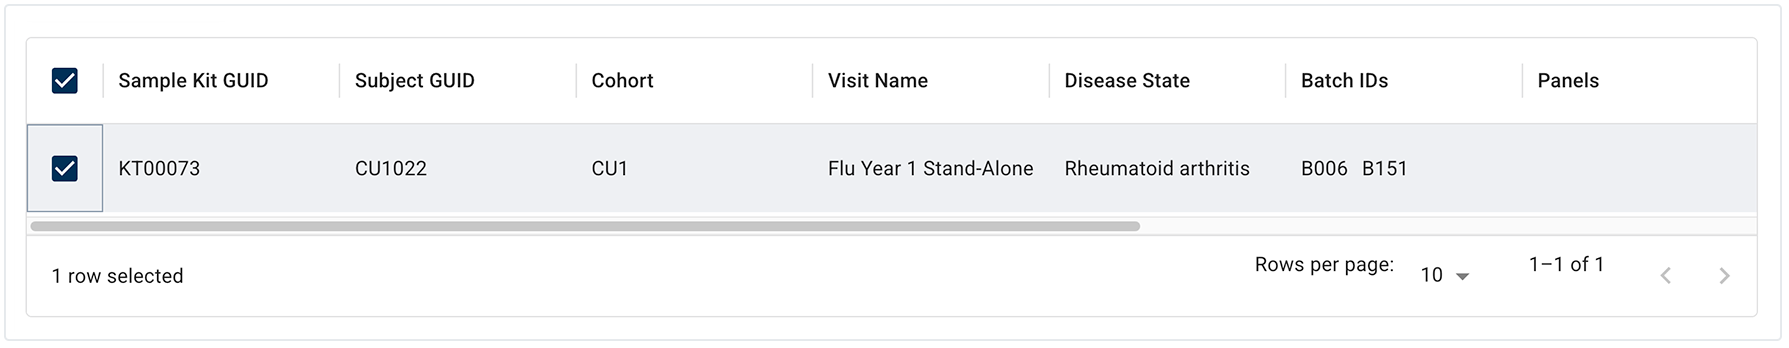
Suppose you want to review samples from a specific project that were processed in one batch using a particular sample kit.
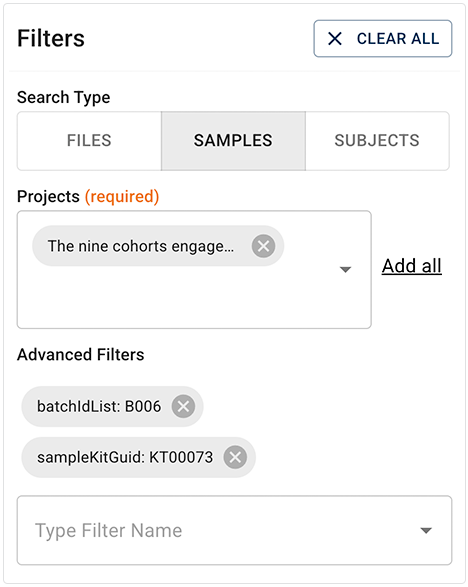
1. In the Filters panel, select SAMPLES as the search type.

2. In the Projects field, choose The nine cohorts engage… as your project.
3. In the Sample Metadata group in the Advanced Filters section, click the Batch ID filter.
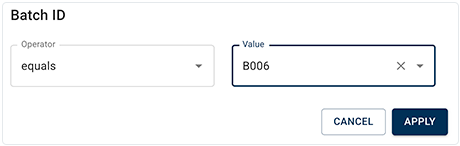
4. In the Batch ID dialog box, choose equals as the operator and B006 as the value, and click APPLY.
5. Return to the Sample Metadata group in the Advanced Filters section, and choose the Sample Kit GUID filter.
6. In the Sample Kit GUID dialog box, choose equals as the operator and KT00073 as the value, and click APPLY.
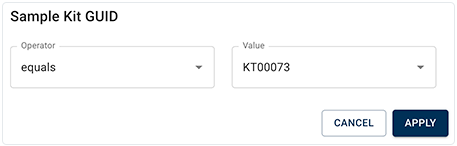
The result is the only sample that matches both criteria.
7. From the floating Options box, choose an option

A. To analyze or transform the data in Python or R in a Jupyter notebook, click GET IDE SCRIPTS.
1. In the Query IDE Scripts box, click the copy icon. Use it to load the filtered data set into your IDE environment, where you control the libraries, methods, and outputs.
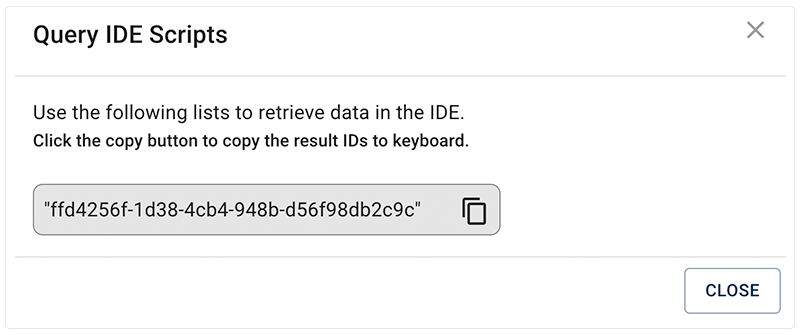
2. Click CLOSE.
B. To explore or compare results in the UI using an existing visualization template or a saved visualization, or to share a view with your collaborators, click VISUALIZE. For details, see the Visualizations documentation.
 Related Resources
Understand Advanced Search Concepts
Use Advanced Search for Basic Queries (Tutorial)